Fed Balance Sheet January 9, 2014: The Fed's balance sheet is a report showing factors supplying reserves into the banking system and factors absorbing (using) reserve funds. Essentially, the balance sheet shows the various Fed programs for injecting liquidity into the economy and how much the Fed has used each for adding or withdrawing reserves. For the January 8 week, the Fed balance sheet expanded by $4.6 billion, following an $8.9 billion contraction in the prior week. Holdings of Treasuries rose $4.2 billion, following a decrease of $0.1 billion while "other assets" (largely those denominated in foreign currencies) increased by $2.9 billion, following a decrease of $1.6 billion the week before. Total assets for the January 8 week were $4.028 trillion. Reserve Bank credit for the January 8 week rose $1.2 billion after falling $4.1 billion the prior week.
FRB: H.4.1 Release--Factors Affecting Reserve Balances--January 9, 2014: Federal Reserve Statistical Release - Factors Affecting Reserve Balances of Depository Institutions and Condition Statement of Federal Reserve Banks
FOMC Minutes: "Proceed cautiously" with QE3 Tapering - From the Fed: Minutes of the Federal Open Market Committee, December 17-18, 2013 . Excerpt: In their discussion of monetary policy in the period ahead, most members agreed that the cumulative improvement in labor market conditions and the likelihood that the improvement would be sustained indicated that the Committee could appropriately begin to slow the pace of its asset purchases at this meeting. However, members also weighed a number of considerations regarding such an action, including their degree of confidence in prospects for sustained above-potential economic growth, continued improvement in labor market conditions, and a return of inflation to its mandate-consistent level over time. Some also expressed concern about the potential for an unintended tightening of financial conditions if a reduction in the pace of asset purchases was misinterpreted as signaling that the Committee was likely to withdraw policy accommodation more quickly than had been anticipated. As a consequence, many members judged that the Committee should proceed cautiously in taking its first action to reduce the pace of asset purchases and should indicate that further reductions would be undertaken in measured steps. Members also stressed the need to underscore that the pace of asset purchases was not on a preset course and would remain contingent on the Committee's outlook for the labor market and inflation as well as its assessment of the efficacy and costs of purchases. Consistent with this approach, the Committee agreed that, beginning in January, it would add to its holdings of agency mortgage-backed securities at a pace of $35 billion per month rather than $40 billion per month, and add to its holdings of longer-term Treasury securities at a pace of $40 billion per month rather than $45 billion per month.
Key Passages in Fed Minutes: Consensus on QE, Focus on Bubbles - Federal Reserve officials were largely in agreement on the decision to begin winding down an $85 billion-per-month bond-buying program. As they looked to 2014, they began to focus more on the risk of bubbles and financial excess. Here is a look at key passages in the minutes of the Dec. 17-18 meeting of the Fed’s policy committee, released Wednesday: Participants generally anticipated that the improvement in labor market conditions would continue, and most had become more confident in that outlook. Against this backdrop, most participants saw a reduction in the pace of purchases as appropriate at this meeting and consistent with the Committee’s previous policy communications.Some … expressed concern about the potential for an unintended tightening of financial conditions if a reduction in the pace of asset purchases was misinterpreted as signaling that the Committee was likely to withdraw policy accommodation more quickly than had been anticipated. As a consequence, many members judged that the Committee should proceed cautiously in taking its first action to reduce the pace of asset purchases and should indicate that further reductions would be undertaken in measured steps.Several [Fed officials] commented on the rise in forward price-to-earnings ratios for some small cap stocks, the increased level of equity repurchases, or the rise in margin credit. One pointed to the increase in issuance of leveraged loans this year and the apparent decline in the average quality of such loans. A couple of participants offered views on the role of financial stability in monetary policy decision making more broadly. One proposed that the Committee analyze more explicitly the potential consequences of specific risks to the financial system for its dual-mandate objectives and take account of the possible effects of monetary policy on such risks in its assessment of appropriate policy. Another suggested that the importance of financial stability considerations in the Committee’s deliberations would likely increase over time as progress is made toward the Committee’s objectives, and that such considerations should be incorporated into forward guidance for the federal funds rate and asset purchases.
Fed Watch: FOMC Minutes - The Quick Review - Near the beginning of the minutes, the staff presents a survey on the expected costs and benefits of the asset purchase program. I feel I need to highlight this section since I have complained that the Fed is leaving us in the dark on the cost/benefit calculus. Now I know why they are leaving us in the dark - they are pretty much in the dark themselves. They sense that the math still favors ongoing purchases:Most participants judged the marginal costs of asset purchases as unlikely to be sufficient, relative to their marginal benefits, to justify ending the purchases now or relatively soon; a few participants identified some possible costs as being more substantial, indicating that the costs could justify ending purchases now or relatively soon even if the Committee's macroeconomic goals for the purchase program had not yet been achieved. Still, they are worried about financial stability:Participants were most concerned about the marginal cost of additional asset purchases arising from risks to financial stability, pointing out that a highly accommodative stance of monetary policy could provide an incentive for excessive risk-taking in the financial sector. And they really don't know what they are doing: It was noted that the risks to financial stability could be somewhat larger in the case of asset purchases than in the case of interest rate policy because purchases work in part by affecting term premiums and policymakers have less experience with term premium effects than with more conventional interest rate policy. Some continue to think of the Fed's balance sheet like that of a regular bank: Participants also expressed some concern that additional asset purchases increase the likelihood that the Federal Reserve might at some point suffer capital losses. I think it silly to complain about potential future losses without acknowledging the current profits; the asset purchase program needs to be evaluated across its entire lifespan. Moreover, it's silly to think the Federal Reserve needs to make a "profit" as if it were a regular bank. The Federal Reserve does not exist to make a profit. It exists to conduct the monetary policy of the nation. But I digress. In any event, policymakers should actually understand this, and hopefully recognize that the only reason for concern on this point is the public optics.
Fed Minutes Show Majority Believe "Marginal Efficacy of QE Likely Declining"; Economy Turned the Corner? - Inquiring minds are reading Minutes of the December 17-18 FOMC Meeting to see what the Fed is thinking. Here are a few key paragraphs: Most participants judged the marginal costs of asset purchases as unlikely to be sufficient, relative to their marginal benefits, to justify ending the purchases now or relatively soon; a few participants identified some possible costs as being more substantial, indicating that the costs could justify ending purchases now or relatively soon even if the Committee's macroeconomic goals for the purchase program had not yet been achieved. Participants were most concerned about the marginal cost of additional asset purchases arising from risks to financial stability, pointing out that a highly accommodative stance of monetary policy could provide an incentive for excessive risk-taking in the financial sector. It was noted that the risks to financial stability could be somewhat larger in the case of asset purchases than in the case of interest rate policy because purchases work in part by affecting term premiums and policymakers have less experience with term premium effects than with more conventional interest rate policy. Participants also expressed some concern that additional asset purchases increase the likelihood that the Federal Reserve might at some point suffer capital losses. A majority of participants judged that the marginal efficacy of purchases was likely declining as purchases continue, although some noted the difficulty inherent in making such an assessment. A couple of participants thought that the marginal efficacy of the program was not declining, as evidenced by the substantial effects in financial markets in recent months of news about the likely path of purchases.
FRB: Press Release--Federal Reserve issues FOMC statement from December 18, 2013
Still unclear exactly how QE eases conditions: Fed's Dudley - Extensive research into massive asset-purchase programs has not yet clarified whether such policies ease financial conditions primarily as a signal to investors or more directly through private portfolios, an influential U.S. central banker said on Saturday.The Federal Reserve is currently buying $75 billion a month in Treasuries and mortgage bonds in its third round of quantitative easing, or QE3, which is meant to ease longer-term borrowing costs in the economy."We still don't have well-developed macro-models that incorporate a realistic financial sector,' William Dudley, president of the New York Fed, told an economics conference. "We don't understand fully how large-scale asset purchase programs work to ease financial market conditions, there's still a lot of debate ..." he said. "Is it the effect of the purchases on the portfolios of private investors, or alternatively is the major channel one of signaling?"
New York Fed Chief Sees Mystery in Bond Buying - Federal Reserve Bank of New York President William Dudley said on Saturday that some key aspects of how the central bank’s bond-buying stimulus effort works remain mysterious. For more than a year, the Fed has been engaged in purchasing Treasury and mortgage bonds in a bid to drive up growth and lower unemployment. The program has been controversial. While officials like Mr. Dudley and Fed Chairman Ben Bernanke see clear benefits, others have struggled to gauge the impact of the effort. Leaders at the Kansas City and Dallas Fed banks see scant value in the buying and worry its impact is instead setting the stage for new asset-market bubbles. On the other side, some central bankers have even attempted to provide fairly clear metrics about the influence of asset buying on things like the unemployment rate. A speech last autumn by San Francisco Fed leader John Williams held that a past iteration of Fed bond-buying led to a tangible decline in the unemployment rate. Mr. Dudley acknowledged a lot is still unknown about how the bond buying works. His observation is important because he has long been a supporter of aggressive Fed actions to help the economy. Referring to the Fed’s stimulus program, Mr. Dudley said, “we don’t understand fully how large-scale asset-purchase programs work to ease financial market conditions—is it the effect of the purchases on the portfolios of private investors, or alternatively is the major channel one of signaling?”
Dudley: Unclear exactly how Fed bond buying works --Federal Reserve Bank of New York President William Dudley said Saturday some key aspects of how the central bank's bond-buying stimulus effort works remain mysterious. For over a year, the Fed has been engaged in purchasing Treasury and mortgage bonds in a bid to drive up growth and lower unemployment. Citing an improving economy, the Fed cut the pace of those purchases last month, and many market participants expect a steady reduction to happen over the course of the year. The program has been controversial. While officials like Mr. Dudley and Fed Chairman Ben Bernanke see clear benefits, others have struggled to gauge the impact of the effort. Leaders at the Kansas City and Dallas Fed banks see scant value in the buying and worry its impact is instead setting stage for new asset market bubbles. On the other side, some central bankers have even attempted to provide fairly clear metrics about the influence of asset buying on things like the unemployment rate. A speech last autumn by San Francisco Fed leader John Williams held that a past iteration of Fed bond buying lead to a tangible decline in the unemployment rate. Speaking as part of a panel in Philadelphia on the activities of the regional Fed banks, Mr. Dudley acknowledged a lot is still unknown about the impact of the bond buying. His observation is important because the official has long been a supporter of aggressive Fed actions to help the economy. The New York Fed leader has for some time expressed support for continuing the purchases, even as he also voted in favor of the Fed's decision last month to cut back on the buying.
Fed's Bill Dudley: The Fed Doesn't Fully Understand How QE Works -- Well, it took three years, but finally the Goldman Sachs-based head of the New York Fed, Bill Dudley, admitted what we all knew. From a speech just given by NY Fed's Bill Dudley at the 2014 AEA meeting in Philadelphia:"We don't understand fully how large-scale asset purchase programs work to ease financial market conditions" Or, in other words, "we still don't know how QE works." It just does (thank you Kevin Henry). And this coming from the people who want their word to become equivalent to gospel in a time when QE is being phased out and replaced with forward guidance. Luckily, at least the Fed knows all about how "forward guidance" works. The good news: it only took $4+ trillion in Fed "assets" for the central bank to understand it had no idea what it was doing.
Fed's Williams: Fed Likely to Taper More, End Bond-Buying This Year - Federal Reserve Bank of San Francisco President John Williams said Tuesday he fully supported the central bank’s recent decision to pull back on its easy-money policies last month, and added that he expects to see the Fed’s bond-buying purchases end at some point this year. The official was referring to the Fed’s decision to slow the pace of its bond-buying stimulus program in December. Then, central bankers cut the monthly pace of Treasury and mortgage purchases to $75 billion from $85 billion, amid rising confidence in the economic outlook. “Assuming the economic recovery plays out as we expect, we will likely continue to reduce the pace of those purchases, and eventually eliminate them, over this year,” Mr. Williams said. Speaking to reporters after his speech, he said he expects to see a “steady, measured” pace of cuts in the program absent some major shock in the economy. Mr. Williams told reporters that when central bankers met last month, they faced a “pretty straightforward” story of economic improvement and less uncertainty from the government. “I fully supported” the decision to slow the bond buying, he said. In his formal remarks to a bankers’ group in Phoenix, Ariz., the central banker said “with the economy having improved so much and the future looking brighter, it was time to start taking our foot off the accelerator and ease up on the monetary stimulus.”
Fed’s Rosengren Says Economy Far From Where Needed - Despite clearer signs of a U.S. economic recovery, its gradual nature comes with potentially deep-rooted costs that warrant the Federal Reserve to keep its policy highly accommodative, a top central bank official said Tuesday. “There are significant costs to a slow recovery,” “It can potentially have longer-lasting and structural implications for labor markets and the economy. There may also be an impact on the Federal Reserve’s ability to reach its inflation target in a reasonable time frame.” Because the central bank is falling short on each of its two mandates–achieving full employment and maintaining stable inflation–”by fairly large margins,” Mr. Rosengren said there is “ample justification” for the Fed to keep monetary policy highly stimulative to support growth. In December, the Fed’s policy-setting board decided to reduce its $85 billion monthly bond-buying program by $10 billion starting in January. Mr. Rosengren, who no longer has a voting slot this year, was the sole dissenter at that meeting. On the employment front, the central banker isn’t fully convinced the labor market is as strong as the recent decline in the unemployment rate might suggest. Last reported at 7% for November, Mr. Rosengren said the figure is still far short of the 5.25% he estimates as full employment in the U.S. The official also pointed to a low quit rate, which suggests workers aren’t confident enough to leave their jobs for potentially better prospects even amid tepid wage growth. He also warned about employment in the prime working-age group of 25 to 54 growing only in line with its population, as well as the unusually high level of long-term joblessness.
Rapid QE withdrawal could permanently harm U.S. workers: Fed's Rosengren - A dovish U.S. central banker on Saturday again urged the Federal Reserve to be patient as it trims its support for the economy, in part because it risks permanent damage to the labor market. Boston Fed President Eric Rosengren dissented against the central bank's landmark decision last month to reduce its bond-buying program by $10 billion to $75 billion in purchases per month. In a speech here, he repeated it was a mistake because unemployment remains too high and inflation too low. "Policymakers have the opportunity to be patient in removing accommodation, speeding up the process of achieving both elements of the Fed's dual mandate" of maximum sustainable employment and inflation of around 2 percent, he said. Rosengren, who had earlier told Reuters he preferred to wait until March to cut QE, said on Saturday the risks of continuing the bond-buying at the previous $85-billion pace seem small relative to the risks of a permanent rise in the number of Americans who are out of work."The failure of monetary and fiscal policy to generate a more rapid recovery risks creating a long-term structural unemployment problem out of a severe cyclical downturn. This concern also underlies my dissent," he said at a meeting of the American Economic Association.
Federal Reserve’s Kocherlakota: Fed May Need to Do More – Federal Reserve Bank of Minneapolis President Narayana Kocherlakota said Thursday evening weak inflation and “too high” levels of unemployment argue in favor of the central bank doing more to help the economy. But at the same time, the incoming voting member of the monetary-policy setting Federal Open Market Committee also expressed qualified support for pulling back on the Fed’s bond-buying program. Mr. Kocherlakota is one of the Fed’s most consistent supporters of aggressive action to aid the economy, and he has stood apart from many of his colleagues and called for additional forms of action to boost employment at a time where the Fed has taken concrete steps toward lowering its level of support for the economy. The Fed “could do better with respect to both of its congressionally mandated objectives by adopting a more accommodative monetary policy stance,” Mr. Kocherlakota said at a public forum held at his bank Thursday evening. He spoke in the wake of the Fed’s decision last month to cut the pace of its bond-buying stimulus program to $75 billion a month, from $85 billion. Most expect the cuts to continue through the course of the year. On Tuesday, San Francisco Fed leader John Williams said it is likely an improving economy will allow the central bank to steadily reduce the pace of buying at the year progresses. Market participants see the program ending later this year. In his remarks, Mr. Kocherlakota appeared to agree with the move to cut bond buying. “As long as the economy evolves according to our outlook…we will continue a pattern of reducing” the pace of bond buying, he said.
Fed's Plosser at odds with policy approach favored by Yellen - The Great Recession could have done permanent damage to potential U.S. output, a top Federal Reserve official said on Saturday, taking an indirect shot at more cyclical approaches to policy-making that is favored by many economists, including the next Fed chair. Philadelphia Fed President Charles Plosser said in a speech he is skeptical of so-called "optimal control" approaches to monetary policy in which mathematical models are used to predict when things like unemployment and economic growth will return to more normal levels. Fed Vice Chair Janet Yellen, who is set to take the reins at the U.S. central bank next month, has often touted this approach, including tolerating higher inflation for a short time in order to speed up the overall economic recovery. Plosser - who regains a vote on policy this year under the Fed's rotating system - is among the minority of hawks who oppose policies such as large-scale bond-buying. "Measures that arbitrarily, or by assumption, assign the bulk of fluctuation in GDP to purely temporary factors may provide poor policy guidance when shocks are more permanent in nature,"
Fed Watch: A Weekend of Fedspeak - Federal Reserve speakers were out in force this weekend at the American Economic Association's annual meeting in Philadelphia. The first rumblings from Fed speakers came from the hawkish-side of the aisle. Via MarketWatch: Philadelphia Fed President Charles Plosser warned Friday that the central bank may have to be "aggressive" in lifting interest rates and may have to chase market rates higher, if banks were to quickly release reserves. He also suggested the expectations of his colleagues by the end of 2016 that calls for Fed funds rates to be below 2% even when the job market is back to normal may be too low. This should come as no surprise - Plosser has tended to be wary of the Fed's accommodative stance. There is nothing here we don't already know. As it stands today, the Fed is comfortable with a steep yield curve. So all Plosser is telling us is that his inflation forecast differs from the FOMC as a whole, and if his forecast is realized, then policy will change accordingly. More interestingly, in a later speech Plosser challenged incoming Federal Reserve Chair Janet Yellen's preferred policy framework: What such framework would Plosser suggest? From 2010: So, if we have problems in measuring output gaps, what type of rule should we use? I believe it makes more sense to use an interest rate rule that responds aggressively to movements in inflation relative to a target and, if it responds to real economic activity, responds to a measure of the change in economic activity itself rather than some deviation from unobserved potential. But, but, but...why then is Plosser so hawkish? Inflation has been moving away from target, so it would seem that he should be taking a dovish stance. How exactly is he going to mount a challenge to a Yellen Fed's basic policy approach? By jointly arguing that policy is too loosely and suggesting a rule that, if followed, would loosen policy further? I am just not seeing it, and thus not seeing how Plosser would be effective in affecting Fed policy.
Fed Watch: How Divided is the Fed? - The minutes of the December 2013 FOMC meeting will be released Wednesday. I am looking for divisions within the FOMC on key topics, notably likely timing of the first rate hike, likely pace of rate hikes, and discussion of what follows the Evans rule. I am not so much concerned with the tapering process at this point. In my mind, that is now something of a dead issue. Barring any large shifts in the pace of economic activity, I think the Fed is largely committed to winding down that program this year. And I think that the Fed is likely committed to low interest rates through 2014. It's in the 2015 policy outlook that the real divisions start to show.As far as quantitative easing is concerned, I think the Federal Reserve is looking to end the program. Although they have not fully explained the calculus in the background, I think the cost/benefit analysis shifted against asset purchases. Moreover, the markets did not collapse after policymakers pulled the trigger on the taper, and everyone (all right, everyone but Boston Federal Reserve President Eric Rosengren) seems relatively comfortable with the pace at with asset purchases are expected draw to a close. Sure, arguably the hawks would like to see it brought to a close sooner than later, but are really just happy to see a path out, a clear indication that there is no such thing as QEInfinity.With regards to interest rates in 2014, here again I think the vast majority of FOMC members are comfortable with the idea that short term rates will most likely hold near zero for the remainder of the year. Even if the US economy receives a faster than expected burst of cyclical activity, the still large output gap and high unemployment rate suggest there is room to let the growth engine run on all cylinders for awhile This is especially the case given the inflation numbers. There is enough uncertainty about inflation, however, that I think the Fed will hesitate to lower the unemployment threshold.
This is the biggest challenge Janet Yellen will face as Fed chair - Two things are happening today in economic news. First, Janet Yellen is to be confirmed Monday evening to head the Federal Reserve. And second, Larry Summers, whom many of the president's advisers favored for the Fed post, published this buzzy op/ed in The Washington Post that sheds light on how he would be thinking about the economy, and monetary policy, if he were the one about to ascend to the big job. The timing is surely coincidence. But as it happens, the issues Summers analyzes in his piece amount to some of the most important questions that Yellen will have to wrestle with as Fed chair. Summers looks at the last 15 years or so of economic history and sees a disconcerting pattern. U.S. economic growth has been anemic -- even outside of the crisis years of 2008 and 2009, and despite years of low interest rate policies out of the Federal Reserve aimed at boosting the expansion. Summers's argument is that there are deeper problems afoot in the U.S. economy, and that so long as the Fed keeps trying to coax growth through easy money policies, without corresponding efforts by fiscal policymakers to increase demand in the economy or structural reforms to boost the country's longer-term economic potential, we are consigned to a cycle of endlessly expanding credit and asset bubbles. "If the United States were to enjoy several years of healthy growth under anything like current credit conditions, there is every reason to expect a return to the kind of problems of bubbles and excess lending seen in 2005 to 2007," Summers writes, "long before output and employment returned to normal trend growth or inflation picked up again."
White House nominates three in potential reshape of Fed - President Barack Obama may not get the chance to remake the composition of the Supreme Court but he'll get to do that at the Federal Reserve if his three eclectic nominees announced Friday are approved by Congress.Fresh on the heels of Monday's confirmation of Janet Yellen as the first woman ever to head the world's most influential central bank, Obama offered three more candidates to join the Fed's Board of Governors.In an unusual move that had been rumored for weeks, Obama nominated Stanley Fischer to join the Fed and be its vice chairman. What makes the pick different is that Fischer served as governor of the Bank of Israel from 2005 until last year, navigating that central bank during a time of global turmoil.Before that Fischer was vice chairman of Citigroup from 2002 to 2005, a time when many of the exotic financial instruments flourished that eventually caused the near collapse of the global financial system.The tenure at Citi might turn off some Democrats who decry the revolving door between the Treasury Department, Fed and Wall Street. .Obama also nominated Jerome Powell to continue serving as a Fed governor, a post he now holds. Powell was a partner in the private-equity firm The Carlyle Group from 1997 to 2005, and before that served as undersecretary of the Treasury Department during the presidency of George H.W. Bush. The only nominee without Wall Street ties was Lael Brainard, who served as Obama's Treasury undersecretary for international affairs from 2010 to 2013 and was involved in efforts to harmonize financial regulation across the globe. Prior to that she was a prominent economic researcher at the Brookings Institution and served as an adviser during the Clinton administration.
The Greatest Myth Propagated About The FED: Central Bank Independence (Part 1) - L. Randall Wray - It has been commonplace to speak of central bank independence—as if it were both a reality and a necessity. Discussions of the Fed invariably refer to legislated independence and often to the famous 1951 Accord that apparently settled the matter. [1] While everyone recognizes the Congressionally-imposed dual mandate, the Fed has substantial discretion in its interpretation of the vague call for high employment and low inflation. For a long time economists presumed those goals to be in conflict but in recent years Chairman Greenspan seemed to have successfully argued that pursuit of low inflation rather automatically supports sustainable growth with maximum feasible employment. In any event, nothing is more sacrosanct than the supposed independence of the central bank from the treasury, with the economics profession as well as policymakers ready to defend the prohibition of central bank “financing” of budget deficits. As in many developed nations, this prohibition was written into US law from the founding of the Fed in 1913. In practice, the prohibition is easy to evade, as we found during WWII in the US when budget deficits ran up to a quarter of GDP. It is, then, perhaps a good time to reexamine the thinking behind central bank independence. There are several related issues.First, can a central bank really be independent? In what sense? Political? Operational? Policy formation? Second, should a central bank be independent? In a democracy should monetary policy—purportedly as important as or even more important than fiscal policy—be unaccountable? Why? Finally, what are the potential problems faced if a central bank is not independent? Inflation? Insolvency? (also see The Greatest Myth Propagated About The FED: Central Bank Independence - Part 2)
The Real Scandal at the Federal Reserve - Many observers have been making the case that the zero lower bound (ZLB) on nominal interest rates is the reason for the ongoing economic slump. That is, because nominal interest rates cannot go below zero--it would pay more to hold cash so no one would lend at negative interest rates--they have not been able to fall to the level needed to clear output markets. The ZLB, therefore, is acting like a price floor that is artificially propping-up short-term interest rates and, as with any binding price floor, is creating a surplus. Implicit in this view is the belief that the short-term market-clearing nominal interest rate is negative. Many have a hard time believing this equilibrium or 'natural rate' value of the interest rate can be negative. Others might accept that it was negative in 2008-2009, but not five years later. The answer to this question would go a long ways in ending much confusion. If the answer is yes, then it would not be true that Fed has been 'artificially' suppressing interesting rates as many have claimed. Nor would it be true that the Fed has been enabling the large budget deficits with low financing costs for the treasury department. Finally, it would reveal that U.S. monetary policy has not been that loose despite the Fed's various QE programs. So why has the Federal Reserve not published real-time, monthly estimates of the short-run natural interest rate? The Fed has a huge research staff, lots of resources, and is capable of providing this important information. It should be a scandal that the Federal Reserve, an interest-rate targeting central bank, does not regularly publish the natural interest rate. One cannot intelligibly talk about the stance of monetary policy for an interest-rate targeting bank without first knowing the natural interest rate level.
A study of Financial Repression, part 3… How does it manifest? - Part 1, a basic model … Part 2, Is there evidence of financial repression in the US? When a central bank keeps its base interest rate low, financial repression can manifest. What changes do we see in the economy? And what happens when you combine low interest rates with a falling labor share? The natural real rate of interest is a balanced interest rate between saving and borrowing. Savers receive a real return on their money that matches real economic growth. and The real cost of borrowing money is balanced with real economic growth. There is “economic” balance when the current real interest rate equals the natural real interest rate. Yet, the current real interest rate does not always stay on the path of the natural real interest rate. In financial repression, the current real interest rate is below the path of the natural real interest rate, which has a positive slope with respect to the utilization of labor and capital, When the current real interest rate is below the natural real rate, savers receive less real return than what real economic growth would give, while borrowers pay less real cost than the true cost of growth. In effect there is an implicit transfer of funds from savers to borrowers. The lower return for savers subsidizes the cost of borrowing. Firms that want to borrow to increase productive capacity receive funds at lower real cost. Normal economic growth gives borrowers an instant profit over the cost of borrowing. Thus, investment in productive capacity is subsidized by savers. When interest rate policy enters the area of financial repression, productive capacity can increase faster.
When QE becomes decentralised - In a previous post we presented research by Willem Buiter, Citi chief economist and former BoE MPC member, which he conducted in the mid 2000s, into whether virtual currencies could be a useful mechanism for breaking through the zero-lower bound. The idea in many ways represents an evolved form of QE, in which differentiable units from dollars are pumped into the economy, inducing an effective negative interest rate on dollars due to the fact that there is less of the new currency in circulation than the established one. Seen from this light, the recent rise of private virtual currencies could can be seen as amounting to the market’s own endogenous version of QE. As we noted, even though Buiter was initially skeptical that such a policy could be more useful than taxing currency directly, by the time he penned this post at his FT Maverecon blog in 2009, he seemed to have warmed to the idea, advocating it as a serious option for dealing with the growing depressionary consequences of the banking crisis.Alas, Buiter’s suggestions were not taken too seriously at the time. It’s hard to imagine it now, but back in 2009 the idea of a virtual currency having any value whatsoever (whether issued by the state or by a private network) was a laughable matter — as was the very idea of alternative currency mechanisms. Five years on, however, the endogenous rise of virtual currencies seems to be providing Buiter with the last laugh. Indeed, in the context of Bitcoinmania, Buiter’s proposals look increasingly ahead of the curve.
No Recession in Sight With 98% of the Nation Expected to Expand - Breadth is perhaps my favorite analytical tool for measuring both financial market and economic health. Breadth is a great measure of underlining strength that can help identify shifts in trends before they become apparent. When the major market indexes were hitting new 52-week highs in October 2007 fewer and fewer individual stocks were hitting new highs and many were already in their own private bear markets. In the same vein, while the U.S. economy didn't officially slip into a recession until December 2007 many individual states within the nation had already slipped into recession months previous. This underscores the importance of not focusing solely on headline numbers like where the S&P 500 is trading or what the national GDP rate is. For a constant measurement of the stock market's breadth I track the data each week in my Friday's “Market's Bill of Health” report. For gauging the country's economic breadth I rely on the Philadelphia Fed's state leading and coincident indexes. This week the Philly Fed just released its State Leading Index for November which showed that 49 out of the 50 states are expected to see their coincident indexes grow over the next six months. With 98% of states expected to show growth over the next six months, the risk of a coming recession remains remote. Just look at the sea of green on the Philly Fed's State Leading Index map below, where only Alaska is expected to show contracting economic activity over the next six months. Of note, back in December of 2007 when the U.S. economy first slipped into a recession only 32 states were expected to show economic growth in the first half of 2008, as more than one third of the country was already in a recession. Clearly the present backdrop is bullish and does not offer any impending doom to the current economic expansion.
Vital Signs: ‘Oil’s Well’ for Fourth-Quarter GDP Growth -- Tuesday’s November trade deficit report shows the stark turnaround in the U.S.’s dependence on foreign oil. In dollar terms, imports of petroleum have fallen sharply over the past two years, while exports have surged. As a result, the U.S. trade deficit in oil has narrowed rapidly. The trade balance on other goods hasn’t shown the same improvement. In both nominal and price-adjusted terms, non-oil goods imports have grown faster than similar U.S. exports have over the past two years. That’s a reflection of faster economic growth in the U.S. which tends to pull in more imports while sluggish global growth has slowed the growth in demand for U.S.-made goods. Oil, however, matters greatly when it comes to trade flows. A steep drop in oil imports helped the total November U.S. trade deficit to narrow sharply to $34.3 billion, the smallest gap since 2009. Even after adjusting for price changes, the trade deficit so far in the fourth quarter is significantly less than its third-quarter average. After seeing the improving trade picture, economists have revised up their tracking of fourth-quarter real gross domestic product growth. Stephen Stanley, chief economist at Pierpont Securities, increased his estimate to a 2.3% annualized rate from 1.5% previous. Ian Shepherdson of Pantheon Macroeconomics now sees growth at 3% from 2.5%. And Goldman Sachs economists increased their GDP rate to 2.8% from 2.3%. The smaller trade gap is also a plus for the Federal Reserve. “The narrowing trade deficit should help power the final quarter to better growth than had been feared and that should give new Fed Chair Janet Yellen some wiggle room as she starts the tapering process,”
Deep Freeze May Have Cost Economy About $5 billion — Hunkering down at home rather than going to work, canceling thousands of flights and repairing burst pipes from the Midwest to the Southeast has its price. By one estimate, about $5 billion. The country may be warming up from the polar vortex, but the bone-chilling cold, snow and ice that gripped much of the country — affecting about 200 million people — brought about the biggest economic disruption delivered by the weather since Superstorm Sandy in 2012, said Evan Gold, senior vice president at Planalytics, a business weather intelligence company in suburban Philadelphia. While the impact came nowhere close to Sandy, which caused an estimated $65 billion in property damage alone, the deep freeze’s impact came from its breadth. “There’s a lot of economic activity that didn’t happen,” Gold said. “Some of that will be made up but some of it just gets lost.” Still, Gold noted his $5 billion estimate pales in comparison with an annual gross domestic product of about $15 trillion — working out to maybe one-seventh to one-eighth of one day’s production for the entire country. “It’s a small fraction of a percent, but it’s still an impact,” Gold said.
Of brains and balls: Nassim Taleb's macro bets - Nassim Taleb is a vulgar bombastic windbag, and I like him a lot. His books do a good job of explaining some deep, important finance ideas for a general audience. He has helped popularize the notion of "skin in the game". His trolling of economists is also good for some lulz (I particularly enjoyed his coinage of the term "macrobullshitters"). However, Taleb has a tendency to indulge in a little macrobullshitting of his own. In February of 2010, he advised everyone in the world to short Treasuries: As for Treasuries, “It’s a no brainer, every single human should short U.S. Treasury bonds,” said the hedge fund adviser and financial author. “So long as you see the picture of Larry Summers going to Davos, you have to stay short U.S. Treasuries for another year. It means they (the Obama administration) don’t know what’s going on,” Taleb said. “Every time you see the picture of what’s his name, (Federal Reserve Chairman Ben) Bernanke, and he still has that job, you have to run to make sure your position is active. So long as these two guys are in office, that’s the trade.” Taleb also recommends betting on hyperinflation using options to buy gold and silver and sell Treasuries. This could be regarded as sound trading advice. But the macroeconomics here is just atrocious (and not just because Taleb feigns not to know Ben Bernanke's name). In 2/2010 Taleb was predicting that the world had underestimated the danger of hyperinflation, and that the world would come to realize that the danger was bigger than it had thought, thus causing Treasury yields to spike and making a huge profit for anyone who shorted them. But history ruled against the inflationistas; even as more and more Quantitative Easing was announced, inflation stayed low and stable. In other words, people who think that "money-printing" and deficits lead to inflation were forced to rethink their entire worldview. But probably not before they did damage to the world economy, as John Aziz points out.
US inflation expectations hit eight-month high - FT.com: US inflation expectations have jumped to their highest since May, with central banks and investors seeking insurance against the prospect that a recovering American economy will stoke price pressures. Inflation expectations, as measured by the difference between yields on 10-year nominal Treasury notes and Treasury inflation protected securities (Tips), have risen to 2.28 per cent from a low of around 2.10 a month ago. Tips help insulate holders from the threat of rising prices, as their value increases when the seasonally adjusted consumer price index rises. In contrast, holders of fixed-rate bonds suffer as inflation erodes their value. Higher market expectations for US inflation comes after a tough year for the sector, with big investor outflows and a rare negative annual return characterising the asset class for 2013. US inflation fell last year, wrongfooting buyers of Tips who had expected accelerating consumer prices because of the Federal Reserve’s infusion of money into the financial system under its quantitative easing policy. As the new year has begun, modest exchange traded fund outflows are being outweighed by demand from foreign central banks and other long-term investors focused on seeking inflation protection as it is seen as being a buying opportunity in the wake of the asset classes’ underperformance in 2013.
Fed Likely Sent About $76 Billion to Treasury in 2013, Less Than 2012 - It’s well known that the Federal Reserve’s unconventional programs have been quite the boon to U.S. Treasury’s coffers. By the end of the month, we should know exactly how much the central bank deposited last year. But there’s no need to wait for the official announcement to get a pretty good idea of the profits the Fed sent to Treasury last year: about $76.3 billion, according to a Wall Street Journal analysis of daily Treasury statements. (The final tally the Fed releases later this month won’t exactly match, but it will be close.) That would be somewhat less than in 2012, when the central bank sent a record $88.9 billion to Treasury. The Fed is required to use its income to cover its operating expenses and send much of the rest to the Treasury’s general fund, where it is used to pay government bills and benefits. Much of the Fed’s income in recent years has come from the U.S. Treasury paying interest on government bonds purchased by the central bank. Fed Chairman Ben Bernanke has said that since 2009, the Fed has sent more than $350 billion to Treasury, about equivalent to the amount it had sent during the entire 18-year period before the crisis. Why has the Fed become such a money maker? Since the financial crisis and ensuing recession, the Fed has launched numerous bond-buying programs and other efforts aimed at stabilizing the financial system and later pushing down long-term interest rates to encourage growth. These programs have swelled the Fed’s portfolio of securities to more than $4 trillion by the end of 2013 from less than $900 billion before the crisis. The Fed is collecting a lot of interest on those assets.
In 2013, the Fed Showed Why Fiscal Policy is Still Important - Last April I had a piece in Wonkblog saying we’d get to see whether or not the expansion of monetary policy in fall 2012 would offset 2013 fiscal austerity. I concluded that it wasn’t looking too good at the start, that QE3 was a smart idea anyway (and should go further), and, most importantly, that a fiscal multiplier would be in effect, and we should run a larger deficit and cancel out things like the payroll tax cut while the economy is still fragile. It received a lot of responses at the time (see the endnotes here for a list). Recently, there’s been a wave of posts by Scott Sumner and David Beckworth calling me and others out, saying that the votes are in and it's a victory for the market monetarists, the team that said monetary policy would offset austerity in 2013 and fiscal policy wouldn't matter. (There have also been responses from Brad DeLong and Noah Smith.) I don’t see it. I’m willing to be convinced, but the two clearest tests I saw the market monetarists put forward in early 2013 have resulted in failure. Let’s go through them:
Economists Spar Over U.S. Recovery —Economists John Taylor and Larry Summers exchanged pointed words Saturday about the best approach to spurring the economic recovery. Mr. Taylor, of Stanford University, suggested that the slow recovery—and the economy’s downward trajectory during the 2007-2009 recession—was in part due to the movement of regulatory, monetary and fiscal policy toward “more discretion, more intervention and less predictability.” As examples of unusual policy steps surrounding the crisis, Mr. Taylor cited the government’s bailouts of financial institutions as well as the Federal Reserve’s bond-buying stimulus, known as quantitative easing. Monetary, fiscal and regulatory policy should “get back to regular order,” Mr. Taylor said, to permit growth to pick up. “Get rid of this QE stuff,” he advised, and return to “rules-based monetary policy.” Mr. Summers, of Harvard, said that extraordinary times call for extraordinary measures and not a blind perseverance on a given course that may have worked in the past. Mr. Summers was an adviser to President Barack Obama early in his first term, when a sweeping stimulus act was passed. Do I want my doctor to be “consistently predictable or responsive to” a particular health emergency, Mr. Summers asked. Better, he answered, to have a doctor “evaluating my condition and responding appropriately.” Mr. Taylor acknowledged that, “It’s great to have the all-knowing doctor,” but added that history bears out that the economy does better when policy is “predictable…and rules-based.”
Blame Polarization for Tepid Economic Growth? --There has been a running argument among economists on the extent to which uncertainty over U.S. government policy –taxes, spending and regulation – is a big reason the economy has been so distressingly sluggish.In a skirmish over the weekend at the annual meeting of the American Economic Association, Harvard’s Larry Summers challenged the case that uncertainty is a big problem: Do I want my doctor to be “consistently predictable or responsive to” a particular health emergency, he asked. Better, he answered, to have a doctor “evaluating my condition and responding appropriately.”Stanford’s John Taylor responded: “It’s great to have the all-knowing doctor,” but history bears out that the economy does better when policy is “predictable…and rules-based.”Now the leading advocates of the case that uncertainty over policy is hurting the economy — a band of academics from Stanford, and the University of Chicago – have come up with a new hypothesis: Political polarization is adding to the uncertainty that is hurting the economy.The partisan divide, they argue in a paper presented at the AEA meetings, leads consumers, businesses and investors to expect “more extreme policies, less policy stability and less capacity of policy makers to address pressing problems.” An index of policy uncertainty that these economists created from surveys of newspaper articles shows an increase in uncertainty over economic policy in recent decades that parallels the increase in various measures of political polarization, both in Congress and among voters. While the American system of checks and balances has long been seen as a way to produce stability because it tends to preserve the status quo, that isn’t always true – especially when something like a looming debt ceiling or an unsustainable budget deficit requires a change in the status quo.
Strategies for sustainable growth, by Lawrence Summers - Last month I argued that the U.S. and global economies may be in a period of secular stagnation in which sluggish growth and output, and employment levels well below potential, might coincide for some time to come with problematically low real interest rates. ...More troubling, there are signs of eroding credit standards and inflated asset values. If the United States were to enjoy several years of healthy growth under anything like current credit conditions, there is every reason to expect a return to the kind of problems of bubbles and excess lending seen in 2005 to 2007...The challenge of secular stagnation, then, is not just to achieve reasonable growth but to do so in a financially sustainable way. There are, essentially, three approaches. The first would emphasize ... deep supply-side fundamentals: the skills of the workforce, companies’ capacity for innovation, structural tax reform and ensuring the sustainability of entitlement programs. ...The second strategy, which has dominated U.S. policy in recent years, is lowering relevant interest rates and capital costs as much as possible and relying on regulatory policies to ensure financial stability. ...The third approach — and the one that holds the most promise — is a commitment to raising the level of demand...Secular stagnation is not inevitable. With the right policy choices, the United States can have both reasonable growth and financial stability. But without a clear diagnosis of our problem and a commitment to structural increases in demand, we will be condemned to oscillating between inadequate growth and unsustainable finance. We can do better.
Will the Real “Secular Stagnation Thesis” Please Stand Up - John Taylor - Last Thursday I published an oped in the Wall Street Journal criticizing the new “secular stagnation” view as put forth by Larry Summers in a talk at an IMF conference in November. The topic was also the focus of debate at a session in which Larry and I appeared over the weekend at the AEA meetings with Marty Feldstein, Dale Jorgenson, and Ed Prescott. At the heart of Larry’s thesis is the view that there has been a secular decline in the past decade in the “real interest rate that was consistent with full employment,” and that decline is what I addressed in the oped. (I also gave a paper at the meetings with my views on the subject.) In the meantime, Jared Bernstein decided that my oped was “worth a brief response” because it goes “after an argument that has resonated with many in recent weeks: secular stagnation.” A number of people have asked me about Jared’s response. But to my surprise, I see that he does not even mention the decline in the equilibrium interest rate which is at the heart of the view that Larry put forth. So Jared’s response has missed the main point of the argument between Larry and me, and I’m disappointed that there’s not much to respond to in that regard. Rather Jared seemed to be defending another secular stagnation thesis. I did not address this thesis in my oped. But in trying to defend it, Jared throws out several incorrect and misleading statements about my policy evaluation research.
Summers Calls for U.S. Fiscal Stimulus - An unusually weak and intractable U.S. economic recovery requires another dose of fiscal stimulus to have a fighting chance of being sustained, Harvard economist Lawrence Summers said Saturday. Mr. Summers, speaking at the American Economic Association meeting in Philadelphia, expanded on his notion that the economy is undergoing a period of “secular stagnation” where there are not enough good investment opportunities to enable full employment. “We may be doomed to oscillation between inadequate and slow growth and bubbly, unsustainable and problem-creating growth,” he said. “Fiscal consolidation in such circumstances is a step importantly in the wrong direction.” The situation requires “direct fiscal policy action,” Mr. Summers added. He suggested the Federal Reserve’s loose monetary policy risked creating asset bubbles and therefore could not be pushed much further to support the expansion. “If growth is rapid but associated with financial conditions that are on their way to becoming unsustainable, that in many ways is a corroboration of the line of argument I am presenting,” Mr. Summers said. “Given current conditions, and given current savings and investment propensities, growth wit
Is Larry Summers Right About 'Secular Stagnation'? - Larry Summers argument that the United States economy may be suffering from “secular stagnation,” first made at an I.M.F. conference in November, has focussed attention on just how disappointing America’s economic performance has been over the past decade, and has raised important policy questions that deserve to be widely discussed. Writing in the Washington Post earlier this week, Summers warned that relying on low interest rates to boost the economy for long periods “virtually ensures the emergence of substantial financial bubbles,” and he called for more public and private investment. Having written two books about bubbles, I’m sympathetic to the point that Summers is making, which is essentially a reiteration of the argument that Alvin Hansen and other American Keynesians put forward in the late nineteen-thirties and early forties. However, the way Summers framed the argument, in terms of interest rates, and, particularly, the “natural interest rate”—a concept borrowed from Knut Wicksell, a Swedish economist who lived around the turn of the twentieth century—has caused some unnecessary confusion. To try and clarify Summers’s thesis and illuminate its strengths and weaknesses, I’ll recast it in a way that should be more familiar: in terms of supply and demand.
Summers believes we can reduce bubbles with big budget deficits. - Here's Larry Summers: Last month I argued that the U.S. and global economies may be in a period of secular stagnation; in which sluggish growth and output, and employment levels well below potential, might coincide for some time to come with problematically low real interest rates. Since the start of this century, annual growth in U.S. gross domestic product has averaged less than 1.8 percent. The economy is now operating nearly 10 percent, or more than $1.6 trillion, below what the Congressional Budget Office judged to be its potential path as recently as 2007. And all this is in the face of negative real interest rates for more than five years and extraordinarily easy monetary policies. Lots of problems here. Monetary policy since 2008 has actually been the tightest since Herbert Hoover was President, if we use the criteria recommended by Ben Bernanke in 2003. Summers seems to believe that low interest rates mean easy money, but by that measure money must have been really tight during the German hyperinflation. If the United States were to enjoy several years of healthy growth under anything like current credit conditions, there is every reason to expect a return to the kind of problems of bubbles and excess lending seen in 2005 to 2007 long before output and employment returned to normal trend growth or inflation picked up again. I don't believe in bubbles, but excess lending is certainly possible given all the moral hazard built into our financial system.
More on Summers, Taylor, and Secular Stagnation - I appreciate the fact that John Taylor responded to my recent critique of his WSJ oped debunking the Summers’ thesis of secular stagnation. It’s also timely in that Larry has another piece on the issue that’s worth reading in today’s WaPo. With respect to John–we often disagree but I think we do so without being disagreeable–I didn’t think his response to me was…um…responsive. His main argument is that since I didn’t address the decline in the equilibrium interest rate, we’re talking past each other. …to my surprise, I see that [Jared] does not even mention the decline in the equilibrium interest rate which is at the heart of the view that Larry put forth. So Jared’s response has missed the main point of the argument between Larry and me, and I’m disappointed that there’s not much to respond to in that regard. I’m confuzzled. Both John and Larry (and myself and everyone else who talks about this) frame the issue in terms of weak output, high unemployment, low investment and the decline in potential GDP, even in the face of very low interest rates. John refers readers to a recent piece he wrote on the issue, in which the abstract begins: In recent years the American economy has been growing very slowly averaging only 2 percent per year during the current recovery. The result has been stagnant real incomes and persistently high unemployment. Summers’ oped today begins the same way, pointing to weak output and unemployment even in the face of very low rates. The interest rate point is diagnostic: a near-zero Fed funds rate since 2009 amidst this continued weakness leads Larry to worry about secular stagnation and John to worry about the ACA, Dodd-Frank, et al. No one, John included, denies the fact of the near-zero FFR and the weak recovery.
Secular Stagnation, Green Shoots or What? - Servaas Storm - The Obama administration and the mainstream media are now talking up an imminent recovery, perhaps even a modest boom. We’ve of course heard this many times before during the past five years — and there is no reason why we should be optimistic now. For one, Obama’s optimism stands in sharp contrast to the gloomy spectre raised by former Treasury secretary and key White House adviser Lawrence Summers in speeches made at a Brookings-Hoover conference in October, and then again at an International Monetary Fund conference in November 2013. Mr Summers fears the U.S. has entered a period of “secular stagnation” — a notion proposed by Keynesian economist Alvin Hansen back in the 1930s to explain America’s dismal economic performance—in which sluggish growth and output, and employment levels well below potential, coincide with a problematically low (even negative) equilibrium real interest rates even in the face of extraordinarily easy monetary policy. Summers believes that the negative equilibrium interest rate is caused by the so-called Global Savings Glut—U.S. banks are said to be flooded by the inflow of Asian capital which supposedly depresses the equilibrium interest rate. Initially Summers left the impression that not much could be done to get the economy out of this conundrum, even — somewhat guardedly — hinting at the need for another asset price bubble to restore growth. But in a Financial Times article of January 5, he has clarified his position, arguing that secular stagnation is not inevitable and can be undone by the right policies, essentially fiscal stimulus (in the form of public investment in “green” energy and infrastructure). It is no surprise that Mr Summers’ analysis has stirred up strong responses on the political right. It is easy to predict that these reactions will become even more antagonistic after his recent “coming out” on fiscal stimulus. The tenor of these responses is quite predictable: the pitiful recovery must be blamed on government failure.
The Austerity Flip-Flop -- On April 28, 2013 Paul Krugman clearly said that 2013 was a test of market monetarism: But as Mike Konczal points out, we are in effect getting a test of the market monetarist view right now, with the Fed having adopted more expansionary policies even as fiscal policy tightens. Yesterday (Jan 4, 2014) however, Paul Krugman, said:…I don’t take seriously the claims of market monetarists that the failure of growth to collapse in 2013 somehow showed that fiscal policy doesn’t matter.There are two obfuscations here. First, it wasn’t the market monetarists who established the test it was Konczal and Krugman who laid down the glove so Krugman is saying he doesn’t take his own (April) claims seriously. Second, in April Krugman did appear to take his claims seriously, perhaps because:…the results aren’t looking good for the monetarists: despite the Fed’s fairly dramatic changes in both policy and policy announcements, austerity seems to be taking its toll. Now that the results are in, however, Paul claims that compared to southern Europe American austerity wasn’t so bad or it was really bad but small enough to be offset by “other stuff”: But the ticker tape (April 27, 2013) suggests a much different emphasis (note also that here Paul names “other stuff’ and it is adding to the problem not subtracting): Even more amusingly, arch-Keynesian Paul Krugman now says we are approaching the long run! In a post titled What A Good Year Won’t Prove he says: If 2014 is a year of relatively good growth, you know that many people will take that as somehow refuting Keynesianism — hey, didn’t you guys predict that the economy would never recover without fiscal stimulus? No, we didn’t [the linked post, is from 2009]
How to Tell if Fiscal Policy Works - There is a raging debate in the econo-blogosphere concerning the effectiveness of fiscal policy when the economy is in a deep recession. This question is important because monetary policy loses much of its effectiveness in severe downturns. Why does monetary policy lose its effectiveness in deep recessions? As the economy enters a recession, the Fed responds by lowering the interest rate to stimulate the economy. For mild recessions, that is generally enough to turn the economy around. But in severe recessions even if the Fed lowers its target interest rate to zero – the zero lower bound as it is known – it is generally not enough to bring about a robust recovery. More stimulus is needed. The Fed can turn from traditional interest rate policy to non-traditional policies such as quantitative easing, but those polices do not have anywhere near the effectiveness of traditional interest rate policy and – as we’ve seen in the Great Recession – it is not enough to avoid a highly sluggish recovery. When monetary policy alone is not enough, can fiscal policy be used to provide the extra stimulus that is needed to propel the economy back toward full employment? In theory, the answer is yes. Modern macroeconomic models tell us that while fiscal policy is not a very effective policy tool during normal times, it is very effective at the zero lower bound. However, many observers have argued that the evidence suggests otherwise. Standard Keynesian analysis implies the sequester should have been a drag on the economy, they argue, but the economy did relatively well after the sequester was put into place. But this type of analysis cannot settle questions about the effectiveness of fiscal policy. To understand why, consider an example from economic history.
How Fiat Money Works - Warren Mosler tells a good story that shows how our economy works at its most basic level. Imagine parents create coupons they use to pay their kids for doing chores around the house. They “tax” the kids 10 coupons per week. If the kids don’t have 10 coupons, the parents punish them. “This closely replicates taxation in the real economy, where we have to pay our taxes or face penalties,” Mosler writes.So now our household has its own currency. This is much like the U.S. government, which issues dollars, a fiat currency. (Meaning Uncle Sam doesn’t have to give you something else for it. Say, like a certain weight in gold.) If you think through this simple analogy, all kinds of interesting insights emerge. For example, do the parents have to get coupons from their kids before they can pay them to do any chores? Obviously not. In fact, the parents have to spend their coupons first by paying their children to do chores before they can collect the tax. “How else can the children get the coupons they owe to the parents?” Mosler writes. “Likewise,” he continues, “in the real economy, the federal government, just like this household with its own coupons, doesn’t have to get the dollars it spends from taxing or borrowing or anywhere else to be able to spend them.” The government creates dollars. It doesn’t even have to print them. The vast majority of spending is simply done by adding electronic dollars to bank accounts. Therefore, the U.S. government can’t go bankrupt. It pays all its bills in U.S. dollars, of which it is the sole issuer. This sounds really obvious, but it is amazing how many people — even very smart people — forget this simple fact. They get hysterical about the fiscal deficit or the national debt. (This is not to say there aren’t bad consequences from issuing too many coupons, or from government spending in general.) The only way the U.S. government can default is if it chooses to do so.
Where is the Arithmetic in Rubin’s Financial Times Piece? - Brad Delong -- Right now the U.S. government can issue a 30-year inflation-protected maturity with a yield of 1.5% per year. Right now if the U.S. spends an extra $100 billion next year it gets $200 billion of increased real GDP and $67 billion of additional tax revenue next year, for $33 billion of additional debt and $500 million of additional annual debt interest in the further future. If $200 billion of additional GDP next year has a long-term boost to GDP of even 1/100 as large–either as extra workers set to work brush-up on their skills, as organizations and capital learn more about how to produce, or as greater corporate cash flow leads to productive private or as government purchases are diverted to productive public investment, the extra annual debt service is more than covered by extra taxes produced by higher potential output. Rubin says that stimulus is “no substitute for fiscal discipline”. But as long as interest rates and economic slack are at their current levels, stimulus is fiscal discipline. It is the failure to undertake fiscal stimulus right now that is long-run fiscal profligacy. Why doesn’t this arithmetic show up anywhere in Rubin’s piece?
Another Debt Ceiling Fight Is Coming Up - Wells Fargo economists John E. Silvia and Michael A. Brown sent out a note today titled, "Another Debt Ceiling Deadline." Yes, the debt ceiling is back and we're quickly approaching it. Congress has a few things to take care of in the next few weeks, including the omnibus spending bill, the farm bill and possibly an extension of emergency unemployment benefits. Soon after that, it will face its toughest challenge of the year when Democrats and Republicans will have to find a way to prevent us from defaulting. The deal to end the government shutdown in October raised the debt ceiling until February 7. After that, Treasury can employ extraordinary measures to extend the deadline even further. How long is still up in the air - it could come as soon as late February or as late as June depending on the amount Treasury collects in tax receipts. Either way, the debt ceiling is coming and Republicans have been making it very clear recently that they are gearing up for another fight. President Obama and Democrats are expected to employ the same strategy as they used last fall in refusing to negotiate whatsoever. They (rightly) don't believe that Republicans should be able to demand a ransom for raising the debt ceiling.
Republicans to lower the cost of raising the debt ceiling - In all likelihood the US debt ceiling will need to be raised no later than this coming March. The question now is whether we are going to see a repeat of last October's game of chicken. According to Deutsche Bank, the US sovereign CDS spread has stabilized, with market participants not anticipating a major disruption (note that US CDS is fairly illiquid with "lumpy" trading activity).The showdown in October, followed by the ugly rollout of the ACA Health Insurance Marketplace, has changed the political landscape. As a result, the Republicans' debt limit demands may have shifted away from the original "dollar-for-dollar" spending cuts requirement (the so-called “Boehner Rule” ). And the new ask may be considerably smaller. The Hill: - Mark McKinnon of Hill and Knowlton Strategies said the “equation is pretty clear." “When Republicans screw with the debt ceiling and threaten a government shutdown, their unfavorable ratings go up. When they talk about Obamacare, Democrats’ unfavorables go up,” he said. The GOP demands are likely to be small, a former top GOP aide now on K Street said. That’s because conservative lawmakers and Republicans feeling primary heat will be unlikely to back any debt-limit boost,meaning House Republicans will probably need some Democrats to come to their side. “Most Republicans see that the shutdown was a mistake, and that there is more pragmatism in dealing with the debt ceiling,” said strategist Ron Bonjean.
House GOP Introduces Stopgap Spending Bill - Conceding that negotiations on a broad government spending bill are unlikely to finish in time to meet a Wednesday deadline, House Republican leaders introduced a stopgap funding bill Friday to keep the government funded through Saturday Jan. 18, and allow more time for talks to wrap up. House Appropriations Chairman Hal Rogers (R., Ky.) said he expected negotiations on the broader funding bill to wrap up Sunday or Monday. Congress faces a Wednesday Jan. 15 deadline, when government funding runs out under the terms of the budget deal passed late last year. Mr. Rogers is negotiating agency-by-agency spending levels with his Senate counterparts to fund the government through Sept. 30, the end of the current fiscal year. Mr. Rogers expressed confidence that the deal will not be derailed by remaining differences–which other officials said were related to health-care funding, environmental policy riders and other issues.
Diagrams and Dollars: Modern Money Illustrated (Part 1) - The reason our current Congressional leaders are having such a difficult time with our National Budgeting process is because they’re trying to design a “building” based on an incorrect diagram. No matter how they add up the numbers, they seem incapable of devising a budget that builds America forward in a positive way. In fact, their budgetary efforts more closely resemble the actions of a wrecking crew than a construction team!Here is my best effort to construct the diagram it appears the Congressional leaders are presently trying to use. I’m putting it together, as best I can, from the story they tell us, every day, about the fiscal dilemmas they are struggling to resolve. This diagram is also powerfully reinforced by a news media spinning and reporting daily on the politician’s seemingly futile efforts: The main features of the diagram are two “pots” containing Dollars. One pot is labeled the Private Sector (PS). This is basically the national economy—businesses and corporations, families and foundations, state and local governments, etc. All the transactions that occur in the Private Sector (PS) pot add up to what is called the GDP (gross domestic product). The second “pot” is the Federal Government (FG), and the Dollars contained in this pot are SPENT to pay for public goods –weather forecasting, bridge repairs, Medicare services, etc.—and to make the “transfer” payments like social security, unemployment aid and food stamps that many Americans depend on to one degree or another. The diagram shows that the Dollars in the Federal Government (FG) pot are obtained via two spigots in the Private Sector (PS) pot: one spigot is TAXES, the other is the “BORROWING” spigot through which the Federal Government (FG) obtains Dollars by “selling” Treasury Bonds to the Private Sector.
Pay to Extend Unemployment Benefits? Why Not Pay to Extend Temporary Tax Breaks Too? -- In the battle over whether to extend long-term unemployment benefits, one of the Republican talking points is: Sure, we’ll consider an extension, but it must be paid for. That’s a fine idea. Here’s another: In exactly the same way, Congress should offset the cost of restoring dozens of temporary tax breaks that expired on Dec. 31 by raising other taxes. Here’s how Senate GOP Leader Mitch McConnell (R-KY) put it the other day: “There is no excuse to pass unemployment insurance legislation… without also trying to find the money to pay for it so we’re not adding to a completely unsustainable debt.” Now, simply substitute the phrase…expiring tax provisions…for… unemployment insurance. Why should the rule be different? Tax breaks are not the same, say some. But for the most part, these highly targeted subsidies are precisely the same. Most are nothing more than spending in drag. Just as the unemployment program transfers cash to a specific group, so do the scores of tax credits and other subsidies that some are hot to renew. Only the beneficiaries are different. Instead of the long-term unemployed, they are Manhattan real estate developers, auto racetrack owners, movie studios, distillers of Puerto Rican rum, multinational corporations, makers of alternative fuel vehicles, etc., etc., etc. Every year Congress mindlessly extends them. And simply adds to the deficit.
For the first time ever, half of the members of Congress are millionaires -- For the first time ever, half of US Congressmen, both Democrats and Republicans, are millionaires, according to figures from a group that examines the influence of money on politics. At least 268 of 534 lawmakers currently elected to the House of Representatives and the Senate had a net worth of $1.0 million or more in 2012, according to disclosures filed by all members of Congress. For a few, that figure went into the hundreds of millions — and the median net worth was just over a million, at $1,008,767, according to analysis by the Center for Responsive Politics at OpenSecrets.org. Median figures for Republicans and Democrats in the “millionaires club” are nearly equal, with Democrats edging just a bit ahead with $1.04 million compared to $1.0 million for Republicans.Charting the Decline in Service at the I.R.S. -- The national taxpayer advocate, the ombudswoman for the Internal Revenue Service, has released her annual report about the biggest issues facing the agency. One major concern that the advocate, Nina E. Olson, emphasized was declining customer service at the agency, driven by budget cuts. How much has the service declined? Here’s a chart showing the share of taxpayers who called wanting to speak with a customer representative and actually spoke to one (blue line), and the wait before reaching a representative (green bars):In fiscal year 2013, the I.R.S. answered only 61 percent of such calls, and the average wait was 17.6 minutes.
Time to abolish the corporate tax? - Yesterday we posted a blog looking at a New York Times editorial entitled Abolish the Corporate Income Tax, exposing many of the numerous fallacies and misunderstandings at the base of it. Forgive us for going on about this, but it is important. Now Citizens for Tax Justice in the U.S. has produced an article of their own, which complements ours and adds several more important points. It starts like this: Another year, another campaign to give even bigger breaks to corporations and claim that this will create jobs. In 2014, the campaign opened with a January 5 op-ed by Laurence Kotlikoff in the New York Times titled, “Abolish the Corporate Income Tax.” And it is a campaign: in the United States, the United Kingdom - everywhere, really. It's based on ideology, not practical realities. A U.S.-based correspondent to TJN, with many connections in U.S. tax circles, added in an e-mail yesterday: "Larry is a leading right-wing Boston U economist who is otherwise best known as a former Reagan Council of Econ advisor and a deficit hawk. He means well, but he is generally clueless when it comes to the Real World. Unfortunately his piece is only the latest in a crescendo of right wing voices calling for abolition in the US. And the idea is gaining traction in business circles." Our arguments yesterday - and CTJ's arguments to follow - illustrate that if you support the abolition of the corporate income tax you either have no idea what you are talking about, or you are a shill. We can't think of another explanation (apart from where you are a mix of both.)
Rethinking Homeownership Subsidies - Tax expenditures for homeownership, such as deductions for mortgage interest and property taxes and the partial exclusion for capital gains on the sale of a primary residence, have long been recognized as ineffective, regressive, and extraordinarily expensive—costing $121 billion in 2013 alone. Until now, most reforms—including the Bowles-Simpson deficit-reduction plan—have focused on restructuring the mortgage deduction into a flat-rate credit. But what if we largely replaced the deduction with incentives to buy a house, rather than to run up a lot of mortgage debt? In a new Tax Policy Center paper, we examine three very different tax subsidies for housing. Instead of encouraging people to borrow, they would create incentives for homeownership without tying tax breaks to mortgage debt. Each would be financed by eliminating the deduction for property taxes paid and capping the mortgage interest deduction at 15 percent. Thus, none would add to the deficit over 10 years. Here, briefly, are the three options:
- A permanent First-Time Homebuyers Tax Credit, similar to the provision temporarily in effect during the Great Recession. The credit—$12,000 for singles and $18,000 for married couples—would give new homeowners a one-time lump sum subsidy in the year they purchased a home. The credit would be refundable, allowing households with low income tax burdens to claim the full value of the credit.
- A flat annual subsidy for homeowners. Taxpayers could claim the credit—$870 for singles and $1,300 for couples—in any year in which they owned their home. The credit would be refundable and would phase out for upper-income households.
- An annual 36 percent flat-rate credit for property taxes paid, up to a maximum of $1,400 for single filers and $2,100 for couples. Like the other alternatives, the credit would be refundable.
The Year of the Great Redistribution - Robert Reich - One of the worst epithets that can be leveled at a politician these days is to call him a “redistributionist.” Yet 2013 marked one of the biggest redistributions in recent American history. It was a redistribution upward, from average working people to the owners of America. The stock market ended 2013 at an all-time high — giving stockholders their biggest annual gain in almost two decades. Most Americans didn’t share in those gains, however, because most people haven’t been able to save enough to invest in the stock market. More than two-thirds of Americans live from paycheck to paycheck. The richest 1 percent of Americans owns 35 percent of the value of American-owned shares. The richest 10 percent owns over 80 percent. So in the bull market of 2013, America’s rich hit the jackpot. Since it’s owned mostly by the wealthy, a rise in stock prices simply reflects a transfer of wealth from some of the rich (who cashed in their shares too early) to others of the rich (who bought shares early enough and held on to them long enough to reap the big gains). Where did those profits come from? Here’s where redistribution comes in. American corporations didn’t make most of their money from increased sales (although their foreign sales did increase). They made their big bucks mostly by reducing their costs — especially their biggest single cost: wages. They push wages down because most workers no longer have any bargaining power when it comes to determining pay. The continuing high rate of unemployment — including a record number of long-term jobless, and a large number who have given up looking for work altogether — has allowed employers to set the terms.
Bond mutual funds post $34 billion outflow in Dec -TrimTabs (Reuters) - U.S.-listed bond mutual funds and exchange-traded funds posted an outflow of $34 billion for December, the fourth-highest on record, amid rising interest rates and price declines in fixed income assets, TrimTabs Investment Research said in a report dated Jan. 6. The average bond fund saw a price decline of 1.4 percent last month, bringing the 2013 total drop to 5.7 percent. As a result, "it is not surprising that outflows intensified," said David Santschi, Chief Executive Officer at TrimTabs, in a note. Bond mutual funds redeemed $33.1 billion, while bond ETFs redeemed $900 million. Bond funds posted a seventh consecutive month of outflows, which likely comes as "a shock to asset managers accustomed to year after year of steady inflows into credit funds," TrimTabs said. For the full year in 2013, investors poured $352 billion into all equity mutual funds and ETFs, easily beating the previous record $324 billion of inflows in 2000.
Big Foreign Central Banks and Primary Dealers Want Out! - podcast - Russ Winter and Lee Adler discuss the signs that foreign central banks are reducing their support of US markets and why. Likewise, Primary Dealers, who were positioned massively wrong at the top of the bond bull market are also tip toeing away. Finally, Russ discusses the banker participation report in the gold futures markets, and the action in the Shanghai market, including the implications of the fact that the world’s biggest bullion banks have just established massive long positions. Adler discusses why it’s critical to track foreign central bank purchases of US Treasury and Agency securities and what their current position is telling us about the market. He also takes a look at how wrong Primary Dealers have been in trading Treasuries and why that’s so crucial.
Fund Flow Records Smashed: Equity Funds Get Record $352 Billion Inflow, Bond Funds Lose Record $86 Billion - In yet another example of the extreme bubble optimism regarding equities, Trim Tabs reports (via email), Fund Flow Records Smashed Across the Board in 2013. TrimTabs Investment Research reported today that U.S.-listed equity mutual funds and exchange-traded funds took in a record $352 billion in 2013, smashing the previous record inflow of $324 billion in 2000. Meanwhile, U.S.-listed bond mutual funds and exchange-traded funds redeemed a record $86 billion, topping the previous record outflow of $62 billion in 1994. "The Fed finally succeeded last year in its long-running campaign to coax fund investors to speculate,” said David Santschi, Chief Executive Officer of TrimTabs. “The ‘great rotation’ that some market strategists long anticipated is under way.” In a note to clients, TrimTabs explained that U.S. equity mutual funds and exchange-traded funds received $156 billion in 2013, the first inflow since 2007 and the biggest inflow since the record inflow of $274 billion in 2000. Global equity mutual funds and exchange-traded funds received $195 billion, edging past the previous record inflow of $183 billion in 2006. “Retail investors are particularly enthusiastic about non-U.S. stocks, which should make contrarians wary,” . “Global equity mutual funds took in $137 billion last year, which was more than seven times the inflow of $18 billion into U.S. equity mutual funds. These highly disproportionate inflows occurred even though non-U.S. stocks as a whole badly lagged U.S. stocks.”
JPMorgan expected to pay $2B for role in Madoff case: JPMorgan Chase is expected to pay approximately $2 billion in civil and criminal settlements as early as Tuesday to settle government suspicions that the global bank ignored signs of Bernard Madoff's massive Ponzi scheme. The New York-based bank, where Madoff kept his main checking account for decades, will make the payments in agreements with the U.S. Attorney's office in New York, the Treasury Department and the Office of Comptroller of the Currency, The New York Times and The Wall Street Journal reported. The bulk of the expected financial settlement is expected to go toward helping repay the thousands of ordinary investors, celebrities, charities and others burned by the $17.3 billion fraud. Only about $11.9 billion of that total has been recovered to date. The pending settlements are expected to include a deferred-prosecution agreement that would require JPMorgan to acknowledge the findings of federal investigations and beef up the bank's internal monitoring procedures. The financial penalties would raise the bank's total tab for settling government investigations to $20 billion during the past 12 months.
JPMorgan To Pay Madoff Fraud Victims $1.7 Billion - JPMorgan Chase has agreed to pay $1.7 billion to the victims of Bernard Madoff’s massive Ponzi scheme. Authorities said the banking giant admitted in a settlement unveiled Tuesday that it didn’t have an effective money-laundering program and didn’t file a suspicious activity report on Madoff’s activities, the Wall Street Journal reports. The settlement delays criminal charges against the bank for violations of the Bank Secrecy Act for two years, pending payments to victims and reforms of JPMorgan’s anti-money-laundering policies. The $1.7 billion payment is the largest ever as a result of a Bank Secrecy Act violation, which requires banks to file a report if they detect suspected violations of federal law.
N.Y. Judge OKs JPMorgan $1.7B Deal With Government -— A judge on Wednesday approved a non-prosecution agreement reached after JPMorgan Chase & Co. agreed to pay $1.7 billion to settle criminal charges stemming from its failure to report its concerns about Wall Street swindler Bernard Madoff’s private investment service.U.S. District Judge Kevin Castel said there was nothing about the deal between the nation’s largest bank and the government that would “require judicial intervention to protect the integrity of the process.” He said it seemed the agreement was “knowing and voluntary” and in the best interests of the public. The judge’s approval came a day after the deal was announced in Manhattan by federal authorities. The agreement requires the bank to pay the $1.7 billion forfeiture — the largest by a U.S. bank for a Bank Secrecy Act violation — and to acknowledge failures in its protections against money laundering and reform them.The judge set a January 2016 court date for the government to report whether the bank has complied with the agreement.
JP Morgan Pays $2 Billion to Avoid Prosecution for Its Involvement In Madoff Ponzi Scheme - Bernie Madoff has said all along that JP Morgan knew about – and knowingly profited from – his Ponzi schemes. So JP Morgan has agreed to pay the government $2 billion to avoid investigation and prosecution. While this may sound like a lot of money, it is spare sofa change for a big bank like JP Morgan. It’s not just the Madoff scheme. As shown below, the big banks – including JP Morgan – are manipulating virtually every market – both in the financial sector and the real economy – and breaking virtually every law on the books. Here are just some of the recent improprieties by big banks:
- Laundering money for terrorists (the HSBC employee who blew the whistle on the banks’ money laundering for terrorists and drug cartels says that the giant bank is still laundering money, saying: “The public needs to know that money is still being funneled through HSBC to directly buy guns and bullets to kill our soldiers …. Banks financing … terrorists affects every single American.” He also said: “It is disgusting that our banks are STILL financing terror on 9/11 2013“. And see this)
- Financing illegal arms deals, and funding the manufacture of cluster bombs (and see this and this) and other arms which are banned in most of the world
- Handling money for rogue military operations
- Laundering money for drug cartels. See this, this, this, this and this (indeed, drug dealers kept the banking system afloat during the depths of the 2008 financial crisis). A whistleblower said: “America is losing the drug war because our banks are [still] financing the cartels“, and “Banks financing drug cartels … affects every single American“. And see this.)
- Engaging in mafia-style big-rigging fraud against local governments. See this, this and this
- Shaving money off of virtually every pension transaction they handled over the course of decades, stealing collectively billions of dollars from pensions worldwide. Details here, here, here, here, here, here, here, here, here, here, here and here
- Manipulating aluminum and copper prices
- Manipulating gold prices … on a daily basis
- Charging “storage fees” to store gold bullion … without even buying or storing any gold . And raiding allocated gold accounts
- Committing massive and pervasive fraud both when they initiated mortgage loans and when they foreclosed on them (and see this)
- Pledging the same mortgage multiple times to different buyers. See this, this, this, this and this. This would be like selling your car, and collecting money from 10 different buyers for the same car
- Cheating homeowners by gaming laws meant to protect people from unfair foreclosure
- Committing massive fraud in an $800 trillion dollar market which effects everything from mortgages, student loans, small business loans and city financing
- Manipulating the hundred trillion dollar derivatives market
- Engaging in insider trading of the most important financial information
- Pushing investments which they knew were terrible, and then betting against the same investments to make money for themselves. See this, this, this, this and this
- Engaging in unlawful “frontrunning” to manipulate markets. See this, this, this, this, this and this
- Engaging in unlawful “Wash Trades” to manipulate asset prices. See this, this and this
- Manipulating corporate bonds through derivatives schemes
- Otherwise manipulating markets. And see this
The Invincible JPMorgan -- When JP Morgan paid its record $13 billion fine for problems with its mortgage securitizations, the bank came out of the experience surprisingly unscathed, in large part because Wall Street reckoned that the real guilt lay mainly in the actions of companies that JP Morgan had bought (Bear Stearns and WaMu) rather than in any actions undertaken on its own watch. There was a feeling that the bank was being unfairly singled out for punishment — a feeling which, at least in part, was justified.The latest $2 billion fine, however, which also comes with a deferred prosecution agreement, is entirely on JP Morgan’s shoulders — and still, as Peter Eavis reports, it’s being “taken in stride” by the giant bank. It really seems that CNBC is right, and that profits really do cleanse all sins. How is it that a $450 million fine sufficed to defenestrate the CEO of Barclays, but that Jamie Dimon, overseeing some $20 billion of fines plus a deferred prosecution agreement just in the space of one year, seems to be made of teflon? To answer that question it’s worth looking at the details of what exactly JP Morgan did wrong in this case. The key part of the Deferred Prosecution Packet is Exhibit C, the Statement of Facts, all of which have been “admitted and stipulated” by JP Morgan itself. And it certainly lays out some jaw-dropping behavior on the part of the bank, which oversaw Madoff’s main bank account for more than 20 years: between 1986 and 2008, account #140-081703 received a jaw-dropping $150 billion in total deposits and transfers, and showed a balance of $5.6 billion in August 2008. Even when you’re as big as JP Morgan, that’s a bank account you notice.
Warren, Coburn Push for Increased Transparency on Settlements -- Federal settlements with bad corporate actors often have misleading, inflated dollar amounts attached. For example, the recent mega-settlement between JPMorgan Chase and the Justice Department for mortgage-backed security abuses before the 2008 crash was billed as a $13 billion deal, but right off the top, $4 billion was actually from an earlier settlement with the Federal Housing Finance Agency. Only $2 billion of the remaining penalties applied to after-tax profits, meaning that the bank could write off the rest as a loss for tax purposes. On top of that, the bank was allowed to credit many things it would have done anyway in the regular course of business as payments under the settlement. The final penalty amount paid by JPMorgan is sure to be much less than $13 billion.This isn’t a new phenomenon. Remember the Exxon-Valdez disaster? After the company was finally ordered to pay $500 million, it took a $200 million tax deduction and ended up forking only over three-fifths of the original amount.A lot of these arrangements happen out of the public eye—long after federal officials have heralded their supposedly tough approach to corporate crime. But now, Senators Elizabeth Warren and Tom Coburn plan to introduce a bill forcing federal agencies to be honest about how much they’re really making the corporations pay. The Truth in Settlements Act places a number of demands on federal enforcement agencies when it comes to specificity and transparency of settlements over $1 million.
Elizabeth Warren, Tom Coburn Introduce “Naked Capitalism Was Right About the Corruption of Financial Regulators Act” (Not Actually Called That) - David Dayen - I’ve been going out of my mind the past few days seeing the easily duped traditional media uncritically printing statistical analysis from JPMorgan Chase’s roundelay of get-out-of-jail-almost-free settlements. The gist of it, and this must have been in a Department of Justice release somewhere, is that JPM has “paid” $20 billion over the last calendar year to resolve a variety of disputes, the most recent being their admission that they knew the bogus nature of Bernie Madoff’s business and never generated any suspicious activity reports or raised red flags for regulators (the fact that they took their money out of Madoff feeder funds right before he was arrested being a smoking gun). Peter Eavis at the New York Times scratches his head and wonders how the bank has “taken in stride” all this hemorrhaging of cash in fraud settlements. Well first of all, considering that shareholders effectively pay the fines and nobody in the executive suites has to go to jail, I’d say taking it in stride is a pretty proper reaction. But just as important is that $20 billion is a FAKE NUMBER. I’m going to go ahead and quote Matt Yglesias on this, mostly because he quotes me: But as David Dayen has written, JPMorgan can get away with labeling a lot of stuff they would or should have to do anyway as relief that counts for the purposes of the settlement. When the bank writes down the value of an unrecoverable second-lien on an underwater mortgage, for example, that’s a loss for the bank. But when it goes and applies the cost of that write-down against the legal settlement tab, that’s not an additional loss to the bank—it’s just double counting. It’s not a legal penalty. JPMorgan Chase isn’t worried about paying $20 billion because there is no such number. That the media reports this speaks to their incurious nature, and allows the Justice Department and people like Eric Schneiderman to get away with claiming a “get tough” approach when the settlements look more like back-door bailouts. Along comes Elizabeth Warren with a bill to attack this corruption directly. Warren and Tom Coburn introduced the Truth in Settlements Act, which uses disclosure to force these little games into the open. Under the law, any settlement with federal agencies over $1 million would have to be completely disclosed to the public, with all relevant details out there, including how the topline number gets applied in reality.
Interest Rates Are Manipulated - Bloomberg reports today: Royal Bank of Scotland Group Plc was ordered to pay $50 million by a federal judge in Connecticut over claims that it rigged the London interbank offered rate.RBS Securities Japan Ltd. in April pleaded guilty to wire fraudas part of a settlement of more than $600 million with U.S and U.K. regulators over Libor manipulation, according to court filings. U.S. District Judge Michael P. Shea in New Haventoday sentenced the Tokyo-based unit of RBS, Britain’s biggest publicly owned lender, to pay the agreed-upon fine, according to a Justice Department Justice Department. RBS was among six companies fined a record 1.7 billion euros ($2.3 billion) by the European Union last month for rigging interest rates linked to Libor. The combined fines for manipulating yen Libor and Euribor, the benchmark money-market rate for the euro, are the largest-ever EU cartel penalties. To put the Libor interest rate scandal in perspective:
- The big banks have conspired for years to rig interest rates … upon which $800 trillion in assets are pegged
- This was the largest insider trading scandal ever … and the largest financial scam in world history
- Local governments got ripped off bigtime by the Libor manipulation
- Even though RBS and a handful of other banks have been fined for interest rate manipulation, Libor is still being manipulated. No wonder … the fines are pocket change – the cost of doing business – for the big banks
Indeed, the experts say that big banks will keep manipulating markets unless and until their executives are thrown in jail for fraud.
JPMorgan Settles Pittsburgh Bank Suit Probing U.S. Deal - JPMorgan Chase & Co. (JPM) agreed to settle a Pittsburgh lender’s lawsuit after a judge ordered the New York-based bank to turn over the government’s draft complaint at the center of its $13 billion deal with regulators. Lawyers for the Federal Home Loan Bank of Pittsburgh said yesterday in Pennsylvania state court that they had reached an agreement, without disclosing terms of the deal. The Pittsburgh FHLB sued JPMorgan and credit-ratings companies in 2009 over losses on $1.8 billion in mortgage-backed securities it bought in 2006 and 2007. The deal came less than a month after a judge ordered JPMorgan, the biggest U.S. lender by assets, to give the plaintiff’s lawyers a draft of the U.S. Justice Department’s proposed complaint that the record settlement was based on. That deal resolved allegations involving sales of mortgage bonds that officials said helped fuel the financial crisis of 2008. The Pittsburgh FHLB argued that the conduct and transactions at issue in its case were the same as those addressed in the settlement with the government. The draft complaint, the bank said in court papers, would provide a more detailed account of the federal probe and reveal the name of a JPMorgan employee who cooperated with the federal investigation. Fitch Group Inc., one of the defendants in the Pittsburgh bank’s suit, also agreed to resolve claims against it related to its ratings on mortgage backed securities.
House Financial Services Chairman to Seek a Volcker Rule Change - When Zions Bank announced last month that it expected to take a big loss because of the Volcker Rule, it set off alarms all over Washington. Regulators scrambled to say they were considering changing the rule, but that was evidently not enough for some legislators. Representative Jeb Hensarling, a Republican of Texas and chairman of the House Financial Services Committee, is expected to propose a bill that could open up a huge loophole in the rule. The proposed change could allow banks to create and own securities with many types of investments that are barred under the Volcker Rule, which is intended to prohibit speculative trading by banks while letting them both make markets for customers and hedge other investments. Zions, based in Salt Lake City, said that it expected to post the loss because it owned a large number of collateralized debt obligations that contained trust-preferred securities, known as TruPS, issued by other banks. The bank said it would have to post the loss, which it estimated at $387 million after taxes, because it would no longer be able use an accounting rule that allowed it to keep losses on those securities off its earnings statement, although they were disclosed in footnotes. That accounting treatment depended on the bank being able to say it expected to retain the securities until they matured, something it would not be able to do if the Volcker Rule would require the sale of the securities, even if the sales could be delayed for several years.
The Loopholes In The Volcker Rule - Even the dumbest banker can get around the Volcker rule. The regulators started with a weak statute, and managed to make it weaker. It’s as though they want to avoid offending the banks. It took years of work and thousands of pages of banker whinges to achieve this dubious result in the final implementing regulations. (This article eschews specific cites to the rules. For more detail, see my article behind a paywall at www.taxanalysts.com.) The statute itself, section 619 of the Dodd-Frank Wall Street Reform and Consumer Protection Act (DFA), is weak and has large exemptions called permitted activities. But in the new Volcker regulations, the five agencies charged with enforcement widened the scope of escape from the rule by creating open-ended administrative exclusions. As the sponsors of the Volcker rule, Sens. Levin and Merkley, argued, there is no statutory authority for these exclusions. Beyond that, all of the Volcker rule loopholes are highly dependent on unenforceable standards and self regulation by the banks. We know how well self regulation worked. The loopholes—administrative and statutory—read like a catalogue of the dangerous activities that the DFA should have prohibited but did not. So herewith, a list of the loopholes in the final rule:
Federal Probe Targets Banks Over Bonds -- Federal investigators are probing whether a number of Wall Street banks cheated clients in the years following the financial crisis by deliberately mispricing a type of mortgage bond that was central to the economic turmoil, according to people close to the inquiry. The investigation is a potential blow to the banks, who are just starting to move on from years of intense scrutiny tied to their roles in the crisis. Wall Street's conduct leading up to and during the market convulsions of 2008 already has been closely examined by authorities. The new probe by regulators is the first known wide-ranging examination of mortgage-bond sales by banks in the years that followed. In that postcrisis period, when the economy remained shaky and many markets weren't yet active again, banks still held on their books billions of dollars in hard-to-price assets. Regulators are seeking information about whether banks made significant misrepresentations about some of those assets to make deals.
Feds Target Wall Street Over Post-Crisis Bonds Trading - Federal regulators are investigating whether major Wall Street banks exploited the murky post-crisis financial environment to cheat clients and boost their profits, according to the Wall Street Journal. The investigation centers on whether banks deliberately mis-priced the same mortgage bonds that were central to the 2008 meltdown. Even after the 2008 financial crisis that crashed the U.S. economy, big Wall Street banks held on to billions of dollars in mortgage-backed securities that helped cause the crash. Regulators are investigating whether traders took advantage of the difficult-to-price assets and sold those mortgage-backed securities at depressed or inflated values between 2009 and 2011, the Wall Street Journal reports. The investigation is said to include banks such as Barclays PLC, Citigroup Inc., Deutsche Bank AG, Goldman Sachs Group Inc., JPMorgan Chase, Morgan Stanley, among others. The banks have not yet publicly commented on the investigation, which is said to still be in its early stages.
The Fed Shifts Ground on Big Banks - Simon Johnson - Janet Yellen was confirmed as the new chief this week, and we should expect a major shift in the composition of the board over the next 12 months. Ben Bernanke is leaving, Elizabeth Duke has already resigned, and Sarah Bloom Raskin is moving to the Treasury Department — so there will soon presumably be three new appointments out of seven total positions. (Jerome Powell’s term will expire next month, but he may well be reappointed.) Over the past half-decade the Bernanke Fed was primarily concerned with staving off disaster and then getting an economic recovery going. Ms. Yellen’s Fed obviously inherits the continuation of the latter task, but it also needs to complete crucial financial-sector reforms — and, perhaps most important, to decide on its attitude toward large banks. On this critical issue, there are signs of a potential shift in thinking at the top. Under Alan Greenspan, the Fed went easy on the largest banks — light regulation was the name of the game. And under Mr. Bernanke, while it became clear that some of these banks had managed themselves into great difficulties, there was also concern not to rock the boat too much by pushing for big changes. The Dodd-Frank reform legislation was hardly carried out with alacrity by the Fed. Of late, however, there are definite indications of changes in thinking at the most senior levels of the Federal Reserve System. It is entirely possible that under Ms. Yellen’s direction, the Fed will move further in a sensible direction — meaning that it will seek to limit the damage that very large, complex financial institutions can inflict on the rest of the economy.
Comparing Bank and Supervisory Stress Testing Projections - NY Fed - In the wake of the financial crisis, Congress enacted the Dodd-Frank Act, which requires large bank holding companies (BHCs) and the Federal Reserve to do annual stress tests. One set of tests is based on three hypothetical macroeconomic scenarios developed by the Fed—a baseline scenario reflecting expected economic conditions over the next nine quarters, and adverse and severely adverse scenarios reflecting stressed economic and financial market conditions. In addition to stress tests based on the three Fed scenarios, both the Dodd-Frank Act and the Comprehensive Capital Analysis and Review (CCAR) require BHCs to perform stress tests based on their own scenarios. (An overview of the CCAR stress testing was described in a 2012 Liberty Street Economics blog post.) In addition to being useful for understanding capital weaknesses at individual firms, coordinated stress tests can also provide insight into the vulnerabilities facing the banking industry as a whole. In this post, we look at 2013 stress test projections made by eighteen large U.S. bank holding companies under the requirements of the Dodd-Frank Wall Street Reform and Consumer Protection Act and compare them with supervisory projections made by the Federal Reserve to see if the two sets of projections identify similar vulnerabilities and risks for the banking system.
Unofficial Problem Bank list declines to 618 Institutions -- This is an unofficial list of Problem Banks compiled only from public sources. Here is the unofficial problem bank list for January 3, 2013. Changes and comments from surferdude808: Quiet week to start off the New Year as expected. This week there were two removals and one addition to the Unofficial Problem Bank List. After the changes, the list stands at 618 institutions with assets of $205.6 billion. A year ago, the list held 834 institutions with assets of $311.6 billion. Next week should be as quiet as we do not anticipate the OCC releasing an update on its enforcement actions until January 17th.
Wall Street Predicts $50 Billion Bill to Settle U.S. Mortgage Suits - Wall Street could pay nearly $50 billion to buy peace from federal authorities who are taking aim at the banks over their role in the mortgage crisis, according to interviews and a confidential analysis of the industry’s potential legal exposure. Bracing for a potential reckoning, the banks and their outside lawyers are quietly using JPMorgan Chase’s record $13 billion mortgage settlement in November to do the math and determine just how much each bank might have to pay to move beyond the torrent of government mortgage litigation that has dogged them since the financial crisis. Such calculations, people briefed on the matter said, have gained particular urgency among the banks’ board members. If the settlements materialize, they could yield, according to the analysis, $15 billion in relief for consumers — a mixture of cash payments and other assistance, like reductions in the size of homeowners’ loan payments. A payment of $50 billion, made up of a string of separate deals, would amount to roughly half the total annual profit of large American banks in 2012. The $50 billion figure does not include JPMorgan’s $13 billion payout, which means the ultimate industry tab could exceed $60 billion, according to the analysis. The JPMorgan settlement has stepped up the pressure on other banks to strike their own separate deals in the coming months, some top bank executives say. When the JPMorgan settlement was announced, the Justice Department official who took the lead in brokering the deal, Tony West, said it could offer a model for other financial institutions being investigated in their sales of troubled mortgage investments. The government made JPMorgan a test case, knowing the nation’s largest bank, facing a wide swath of legal woes, was vulnerable. The $13 billion deal has left some on Wall Street worried that the cost of their own deals will now be inflated, the people said.
Alternative Lenders Peddle Pricey Loans -- When Khien Nguyen needed $180,000 to open his 13th nail salon near Philadelphia in November, he didn't go to a bank. He turned instead to one of the nonbank, short-term lenders that have been gaining traction since the financial crisis. The lenders cater to small businesses, often at high cost. Mr. Nguyen is paying 14.9% interest over the loan's six-month term—the equivalent of about 30% annually. Payments are drawn automatically each day from his business bank account. "It's not cheap, but they served my needs quickly," he says. Banks generally require solid credit scores and spend weeks reviewing financial statements, tax returns and business plans. Biz2Credit, an online loan broker for small businesses, says an analysis of loan applications made in December through its website showed big banks approved 18% of loan applications by its customers in December, while small banks approved 49%. Various nontraditional lenders have stepped into the void. Peer-to-peer online-lending platforms channel funds from ordinary investors to borrowers. Private investment partnerships, including hedge funds, make direct loans to struggling businesses, often with costly strings attached. Interest rates on such loans can run in excess of 50%, on an annualized basis, much higher than on conventional bank loans. Usury laws limiting interest rates generally don't apply to the short-term lenders. Some of the loans are originated in states that don't cap interest rates on commercial loans. Others are structured as private contracts between two businesses. Many loans come through brokers working on commission
Morningstar Executive Gives Assessment of New CFPB Rules - "Under the new CFPB [Consumer Financial Protection Bureau] rules, servicers will have to provide very detailed and accurate information to borrowers about each aspect of their loans and/or any foreclosure procedures that may occur,” according to Richard Koch, SVP at Morningstar Credit Ratings. Koch discussed his assessment of the new rules’ impacts in a recent conversation with Louis Amaya, co-founder of iServe Companies on Mortgage Markets Today, a Five Star Radio presentation. “There will be a very strict interpretation of the guidelines with penalties to servicers if they fail to adhere to the new requirements,” Koch said. He explained that the prominent rule changes will impact nine mortgage servicing areas:
- Periodic billing statements—detailed breakdown of the amounts that make up payments
- Adjustable-rate mortgage (ARM) interest rate change notices
- Prompt crediting of payments and payoff payments
- Force-placed insurance
- Error resolution and information requests
- Information management policies and procedures
- Early intervention with delinquent borrowers
- Continuity of contact with delinquent borrowers
Foreclosures by Homeowners’ Associations Rising as Their Financial Condition Worsens -- Yves Smith -- While foreclosures are falling on a nation-wide basis, one category that is an exception is foreclosures filed by homeowners’ associations against members that are delinquent on their fees. And on a more general basis, due to defaults and slow payments, in aggregate, reserves of HOAs have fallen and many have scrimped on services and maintenance as a direct result of the housing bust. Foreclosures by bank servicers has produced an adverse feedback loop: homes in foreclosure sit vacant, often for lengthy periods, and they don’t pay fees to the HOA. That produces shortfalls in the HOA’s revenues versus their needs. Thus when a homeowner now goes into arrears, the HOA has less ability to cut them slack and work out a payment or catch-up plan. This phenomenon is broader than you might imagine. Homeowners’ associations aren’t just a fixture of condominiums in Sunbelt states like Florida and Nevada. 63 million Americans live in residences that are in HOAs, and 80% of new homes sold are subject to these arrangements. They aren’t just a way to pay for common services in multi-family housing; they are increasingly an example of privatization of formerly public services. As a new Reuters story explains: people who buy houses in an association often don’t bother to read the agreements that spell out what covenants owners are obliged to observe. They may unknowingly forfeit the right to fly a flag in the front yard, let a shrub grow any old size, or allow their kids to shoot hoops in the driveway. Homeowner associations typically have the right to place liens against wayward residents. Either through a court or state-regulated process, they can then foreclose on houses worth hundreds of thousands of dollars even for a few hundred dollars of unpaid debt, much like a municipality can for unpaid property taxes or a bank for a few missed mortgage payments. The article starts with the story of a woman who ignored her annual $48 HOA fees, thinking they didn’t apply because she didn’t use any of the services they funded. She lost her home over $288 in unpaid HOA fees. She said she never got any notice that a foreclosure action was underway. Another ignored notices, assuming they were fines because his children were leaving their bikes outside. He lost his $350,000 home to $900 in fines.
Paying for Foreclosure Delays -- The long foreclosure timelines in New York, New Jersey and Connecticut may translate into slightly higher borrowing costs for consumers in those states. The Federal Housing Finance Agency announced last month that, because the stress in housing markets has eased, it was eliminating the across-the-board adverse-market fee instituted in 2008 to help cover the costs of high rates of delinquencies. The fee, applicable to all mortgages bought by Fannie Mae or Freddie Mac, is 25 basis points, or 0.25 percent of the mortgage loan amount. But the agency, citing the “significantly greater costs” associated with much longer foreclosure timelines in the tristate area and in Florida, said the fee would remain in place in these four states. The fee isn’t onerous — an added $5.95 a month, for example, on a 30-year loan of $200,000 at a rate of 4.5 percent. And it isn’t a closing cost, noted Jordan Roth, the senior branch manager of the Manhattan office of GFI Mortgage Bankers. “It is a fee that gets added into the rate or, as we like to say, baked into the rate,” he said. Still, the singling out of states that take a long time to process foreclosures through their judicial systems does represent a shift in regulatory thinking. “It’s effectively a recognition that the cost to lend in a market that has long judicial foreclosure timelines needs to be accounted for,” said Mark Fleming, the chief economist for CoreLogic, a real estate data service. “If it takes two years to get through a foreclosure, time is money.” In an analysis conducted in March, Mr. Fleming found that the timeline from serious delinquency to foreclosure sale in states where foreclosures must go through the judicial system is, on average, 46 percent longer than in nonjudicial states. The added time imposes a cost on loan servicers and investors, he added.
The Government Guide to Screwing Poor Homeowners -- The end of the Mortgage Forgiveness Debt Relief Act, which lapsed December 31, means that any type of debt forgiveness on a mortgage will result in a giant tax bill—one that a stressed homeowner cannot usually afford. Even homeowners entitled to compensation for past abuse by the mortgage-lending industry would be subject to unfavorable tax treatment. This will lead to more economically debilitating foreclosures and weaken the housing market. Principal reductions—cuts to the unpaid balance of a home loan—have been proven time and again to be the most effective method for a homeowner to avoid foreclosure. But there was a problem: For tax purposes, the IRS treats forms of debt relief like principal reduction as gross income. So a $100,000 principal reduction for a family making $50,000 a year would force them to pay taxes as if they earned $150,000, saddling them with a federal tax bill (according to this calculator) of $32,493, or over two-thirds of their annual income. Struggling homeowners don’t typically have bags of cash lying around to pay off tax bills. In 2007, Congress passed the Mortgage Forgiveness Debt Relief Act, exempting mortgage debt forgiveness from taxation. The law was extended twice as the foreclosure crisis lingered. It made it into the 2012 “fiscal cliff” deal at the last minute, extending relief through the end of 2013. But it expired last week, putting homeowners on the hook. The need for mortgage relief is pressing. The most recent statistics show nearly 4.5 million homes are in some stage of delinquency. And more than 6 million homes are “underwater,” with the homeowner owing more than the home is worth. These homes are at risk of foreclosure, but many lower-income borrowers who can’t afford the tax bill will have to turn down mortgage help.
1 in 5 homeowners drowning - RealtyTrac released its U.S. Home Equity & Underwater Report for December 2013, which shows that 9.3 million U.S. residential properties were deeply underwater, or about 1 in 5 of every property with a mortgage. "Deeply underwater" is defined as worth at least 25% less than the combined loans secured by the property. That was down from 10.7 million residential properties deeply underwater in September 2013, representing 23% of all properties with a mortgage, and down from 10.9 million properties deeply underwater in January 2013, representing 26% of all properties with a mortgage. The high watermark for being deeply underwater came in May 2012, when 12.8 million U.S. residential properties were deeply underwater, representing 29% of all properties with a mortgage. "During the housing downturn we saw a downward spiral of falling home prices resulting in rising negative equity, which in turn put millions of homeowners at higher risk for foreclosure when they encountered a trigger event such as job loss," said Daren Blomquist, vice president at RealtyTrac. "Now we are seeing the reverse trend: rising home prices resulting in falling negative equity, which in turn is giving millions of homeowners a lifeline to avoid foreclosure when they encounter a trigger event. On the other end of the spectrum, the percentage of equity-rich homeowners is nearing a tipping point that should result in a larger inventory of homes listed for sale and give the overall economy a nice shot in the arm in 2014."
As Borrowers Emerge from Underwater, Cloud of Problem HELOCs Rises - The percentage of homeowners who owe more on their mortgages than their homes are worth has declined to less than 12 percent as of the third quarter of this year, according to Lender Processing Services’ Mortgage Monitor report. While the increasing number of homeowners rising above water is good news for the market, LPS detects some tumultuous seas ahead as a cloud of problem home equity loans forms on the horizon. The negative equity rate at the beginning of the year was 19 percent, according to LPS. The company estimates it dropped to 11.6 percent by the end of October. LPS SVP Herb Blecher explained the company’s methodology for calculating the negative equity rate.“As reports of estimated U.S. negative equity tend to vary widely, and to clarify our approach, we are applying a highly refined methodology to our calculations, accounting for not only the current combined loan amount of first and second liens using comprehensive loan and property data, but also the impact of distressed sale discounts on loans in serious delinquency and foreclosure,” Blecher said.Close to half—about 48 percent—of today’s outstanding home equity lines of credit (HELOCs) were originated between 2004 and 2006, and more than 75 percent were originated between 2004 and 2009. According to LPS, “the vast majority” of these loans are set to amortize over the next few years.Credit scores among borrowers with HELOCs originated since 2004 are declining, based on LPS’ data. For example, the average credit score for a borrower with a HELOC originated in 2007 was 744 at the time of origination. Those same borrowers today have an average credit score of 724.This poses a threat to lenders who “are often on the hook for almost all of 2nd lien losses,” LPS explained. The average unpaid principal balance on these loans varies from $50,000 for loans originated in 2004 to $70,000 for loans originated in 2006 and 2007, according to LPS’ data. LPS says “alarm bells shouldn’t be going off just yet,” but the company reasons, “if these trends continue— the next few years could present significant risk for defaults in the home equity market.”
The Bubble Is Back – Wallison - Almost everyone understands that the 2007-8 financial crisis was precipitated by the collapse of a huge housing bubble. The Obama administration’s remedy of choice was the Dodd-Frank Act. It is the most restrictive financial regulation since the Great Depression — but it won’t prevent another housing bubble. Housing bubbles are measured by comparing current prices to a reliable index of housing prices. Fortunately, we have one. The United States Bureau of Labor Statistics has been keeping track of the costs of renting a residence since at least 1983; its index shows a steady rise of about 3 percent a year over this 30-year period. This is as it should be; other things being equal, rentals should track the inflation rate. Home prices should do the same. If prices rise much above the rental rate, families theoretically would begin to rent, not buy. Housing bubbles, then, become visible — and can legitimately be called bubbles — when housing prices diverge significantly from rents. In 1997, housing prices began to diverge substantially from rental costs. Between 1997 and 2002, the average compound rate of growth in housing prices was 6 percent, exceeding the average compound growth rate in rentals of 3.34 percent. Today, after the financial crisis, the recession and the slow recovery, the bubble is beginning to grow again. Between 2011 and the third quarter of 2013, housing prices grew by 5.83 percent, again exceeding the increase in rental costs, which was 2 percent. Many commentators will attribute this phenomenon to the Fed’s low interest rates. Maybe so; maybe not. Recall that the Fed’s monetary policy was blamed for the earlier bubble’s growth between 1997 and 2002, even though the Fed raised interest rates during most of that period.
Peter Wallison's Housing Bubble - Dean Baker - Peter Wallison, who was White House Counsel under President Reagan and has long been a fellow at the American Enterprise Institute, told NYT readers today that the housing bubble is back. Wallison is right to be concerned about the return of a bubble, as I have pointed out elsewhere, but his account of the last bubble and the risks of a new one are strangely off the mark. Wallison wants to blame the bubble on government policy of promoting homeownership. There certainly has been a problem of a housing policy that is far too tilted toward homeownership, but this does not explain the bubble. Fannie Mae and Freddie Mac were bad actors in the bubble years, buying up trillions of dollars of loans issued on houses purchased at bubble inflated prices, as I said at the time. However the worst loans were securitized by folks like Citigroup, Merrill Lynch, and Goldman Sachs. They weren't securitizing junk mortgages to meet government goals for low-income homeownership, they were doing it to make money. And they made lots of money in these years. In fact, the private securitizers were so successful in securitizing junk mortgages that they almost put the Federal Housing Authority (FHA) out of business. Since the FHA maintained its lending standards it couldn't compete with the zero down payment loans being securitized on Wall Street. It saw its market share fall to 2 percent at the peak of the bubble. Some of us warned about the problem posed by the bubble in low-income communities at the time. ...
Real Estate Market: We're Not in Another Housing Bubble - The Housing market had a great year in 2013, with the last reading of the Case-Shiller housing index showing a more than 13% appreciation of home prices year-over-year. The rapid ascent in prices however, has some pundits worried that we may be in the midst of another bubble, especially in some regions of the country like California. In fact, the co-founder of the Case-Shiller index himself, 2013 nobel laureate Robert Shiller said on CNBC this week that “We’re sort of in the beginnings of another housing bubble.” But from economist David Blitzer, here’s one chart that shows why we shouldn’t be worried about the housing market suffering another 2007-style bust anytime soon: The above chart shows the loan-to-value ratio for all owner-occupied homes in America. In other words, before the crisis, the average homeowner owed roughly 60 percent of his home’s value to the bank, and that percentage has fallen now to 49%. And this change has made the American economy and housing market much more resistant to a dangerous real estate bubble explosion.
Trouble Ahead for Housing in 2014?: Will the gains that the U.S. housing market made in 2012 and 2013 continue into 2014? As you'll read below, the biggest threat to the housing market is moving in the opposite direction -- against housing. Sure, the Case-Shiller S&P Home Price Index, which tracks prices in the U.S. housing market, shows an overall increase of 13.6% in home prices in the first 10 months of 2013 (see the chart below). But for growth in the housing market to continue, you need favorable market conditions for buyers. Unfortunately, the "favorable" conditions of 2011 through to 2013 are now becoming "unfavorable." Interest rates on mortgages are rising sharply. In November of 2013, the popular 30-year fixed mortgage rate tracked by Freddie Mac stood at 4.26%. In the same period a year ago, this rate was only 3.35%. (Source; Freddie Mac web site, last accessed January 3, 2013.) The interest rate on the standard 30-year fixed mortgage has gone up 27% in twelve months. And the higher mortgage rates go, the more the affordability for home buyers declines. But rising interest rates are not the only factor weighing against the housing market in 2014. Adjustable-rate mortgages (ARMs), which virtually disappeared after 2007, are making a big comeback. According to DataQuick, in November of 2013, about 11% of all homes in Southern California were bought using ARMs. This has doubled in the area from the same period a year ago. (Source: Los Angeles Times, January 1, 2013.) ARMs have a fixed interest rate for a certain period of time, and then rates on the typical ARM adjust to market rates. What will happen to all those home buyers who purchased houses using ARMs over the past three years as interest rates increase? They will have added monthly costs—that's what will happen.
Drivers of Mortgage Choices by Risky Borrowers – SanFran Fed -- During the past decade’s housing boom, borrowers with lower credit ratings were more likely than higher-rated borrowers to choose adjustable-rate mortgages. This raises the question of whether, amid rapidly rising house prices, lower-rated borrowers paid less attention to loan pricing and interest-rate-related factors. However, even accounting for house price appreciation, research shows these borrowers were as, if not more, responsive as higher-rated borrowers to changes in interest-rate-related fundamentals. Their tendency to choose adjustable-rate mortgages is consistent with mortgage decisions based on economic considerations, rather than just lack of financial sophistication.
MBA: Mortgage Applications Increase in Latest Weekly Survey - Note: This release is for two weeks ... from the MBA: Mortgage Applications Increase in Latest MBA Weekly Survey Mortgage applications increased 2.6 percent from one week earlier, according to data from the Mortgage Bankers Association’s (MBA) Weekly Mortgage Applications Survey for the week ending January 3, 2014. The most recent week’s results include an adjustment to account for the New Year’s Day holiday, while the previous week’s results were adjusted for the Christmas holiday. ... The Refinance Index increased 5 percent from the previous week after falling by 9 percent the week prior. The seasonally adjusted Purchase Index decreased 1 percent from one week earlier but increased 2 percent the week prior. ... ... The average contract interest rate for 30-year fixed-rate mortgages with conforming loan balances ($417,000 or less) remained unchanged at 4.72 percent, with points unchanged at 0.28 (including the origination fee) for 80 percent loan-to-value ratio (LTV) loans. The first graph shows the refinance index. The refinance index is down sharply - and down 73% from the levels in early May - and last week was at the lowest level since November 2008 The second graph shows the MBA mortgage purchase index. The 4-week average of the purchase index is now down about 8% from a year ago.
Weekly Update: Housing Tracker Existing Home Inventory up 2.0% year-over-year on Jan 6th - Here is another weekly update on housing inventory ... for the twelfth consecutive week, housing inventory is up year-over-year. This suggests inventory bottomed early in 2013. There is a clear seasonal pattern for inventory, with the low point for inventory in late December or early January, and then peaking in mid-to-late summer. The Realtor (NAR) data is monthly and released with a lag (the most recent data was for November). However Ben at Housing Tracker (Department of Numbers) has provided me some weekly inventory data for the last several years.
Trulia: Asking House Prices up 11.9% year-over-year in December, Price "Rebound effect fading" - From Trulia chief economist Jed Kolko: The Post-Crash Rebound, Not Job Growth, Drove 2013 Price Gains In 2013, the housing markets with the biggest increases in asking prices were all rebounding from severe price drops in the housing bust. In December, the year-over-year increase in asking home prices slowed for the first time since the price recovery began in early 2012: prices rose 11.9% year-over-year in December, compared with November’s 12.2% year-over-year increase. Asking prices rose 0.4% month-over-month, seasonally adjusted, the third straight month of gains less than 1%. Overall, regression analysis shows that recent price gains are most strongly associated with the severity of the local housing bust. Markets where prices fell most during the bust (roughly 2006 to 2011, but varies by metro) offered bargains for investors and other buyers who have helped bid prices back up over the past two years. A second important factor is foreclosures: adjusting for other factors, metros with a higher foreclosure inventory today – including many in Florida – have slower price growth. Job growth, however, had little impact on local home price gains in 2013: the relationship between job growth and price gains was positive but not statistically significant. Therefore, year-over-year price gains in December 2013 are still primarily a reaction to the housing bust, but this rebound effect is fading as we enter 2014. Note: These asking prices are SA (Seasonally Adjusted) - and adjusted for the mix of homes - and this suggests further house price increases, but at a slower rate, over the next few months on a seasonally adjusted basis.
CoreLogic: House Prices up 11.8% Year-over-year in November - The CoreLogic HPI is a three month weighted average and is not seasonally adjusted (NSA). From CoreLogic: CoreLogic Reports Home Prices Rise by 11.8 Percent Year Over Year in November: Year over year, home prices nationwide, including distressed sales, increased 11.8 percent in November 2013 compared to November 2012. This change represents the 21st consecutive monthly year-over-year increase in home prices nationally. On a month-over-month basis, home prices nationwide, including distressed sales, increased by 0.1 percent in November 2013 compared to October 2013. Excluding distressed sales, home prices increased 0.3 percent month over month in November 2013 compared to October 2013. On a year-over-year basis, home prices, excluding distressed sales, increased by 10.4 percent in November 2013 compared to November 2012. Distressed sales include short sales and real-estate owned (REO) transactions. The CoreLogic Pending HPI indicates that December 2013 home prices, including distressed sales, are expected to dip 0.1 percent month over month from November to December 2013, with a projected increase of 11.5 percent on a year-over-year basis from December 2012. This graph shows the national CoreLogic HPI data since 1976. January 2000 = 100. The index was up 0.1% in November, and is up 11.8% over the last year. This index is not seasonally adjusted, and the month-to-month changes will be smaller - or even negative - for next several months. The index is off 17.6% from the peak - and is up 22.4% from the post-bubble low set in February 2012. The second graph is from CoreLogic. The year-over-year comparison has been positive for twenty one consecutive months suggesting house prices bottomed early in 2012 on a national basis (the bump in 2010 was related to the tax credit). This is a slightly smaller year-over-year gain than in October, and I expect the year-over-year price increases to slow in the coming months.
Zillow: Case-Shiller House Price Index expected to show 13.7% year-over-year increase in November -- The Case-Shiller house price indexes for October were released last week. Zillow has started forecasting Case-Shiller a month early - and I like to check the Zillow forecasts since they have been pretty close. It looks like another very strong month ... From Zillow: Case-Shiller Expected to Show Continued Inflated Appreciation The Case-Shiller data for October came out [last week], and based on this information and the November 2013 Zillow Home Value Index (ZHVI, released December 19th) we predict that next month’s Case-Shiller data (November 2013) will show that both the non-seasonally adjusted (NSA) 20-City Composite Home Price Index and the NSA 10-City Composite Home Price Index increased 13.7 percent on a year-over-year basis. The seasonally adjusted (SA) month-over-month change from October to November will be 0.6 percent for both the 20-City Composite and the 10-City Composite Home Price Indices (SA). All forecasts are shown in the table below. . .. the ZHVI does not include foreclosure resales and shows home values for November 2013 up 7.1 percent from year-ago levels. More on the differences between a repeat sales index, including the Case-Shiller indices, and an imputed hedonic index like the ZHVI can be found here. We expect home value appreciation to continue to moderate through the end of 2013 and into 2014, rising 4.6 percent between November 2013 and November 2014 — a rate much more in line with historic appreciation rates. The following table shows the Zillow forecast for the October Case-Shiller index.
Housing Demolitions: The Return of the Bulldozers - Below is an interesting article from Andrew Khouri at the LA Times. As the article notes, demolitions and new construction in beach communities and other desirable areas in California has picked up significantly. The article doesn't mention that many of these small cottages were built in the '20s, '30s, '40s and 50s as summer homes. An example in the article is "a 3,500-square-foot, three-level house that replaced a small 784-square-foot cottage near the beach." The zoning hasn't changed. It just didn't make sense to build a 3,500 sq ft house as a summer home in the '30s. For the new owners, these are mostly primary residences and the owners work nearby. It makes sense that the new owners will want to max out the lot (the lots are very expensive), but, as expected, some existing residences don't want their communities to change. From Andrew Khouri at the LA Times: Housing tear-downs on the rise as real estate rebounds The upscale South Bay town of Manhattan Beach exemplifies the trend. Builders in the city pulled permits to demolish 84 residential units from July 2012 to June 2013, the latest available data. That's nearly double the number pulled for the same period a year earlier. ...In the city of Los Angeles last year, builders received approval to raze 1,227 houses and duplexes from January through mid-December, according to Department of Building and Safety records. That's 29% higher than in all of 2012, though still well off the pace of more than 3,000 in 2006, during the housing bubble.
Aging Boomers to Boost Demand for Apartments, Condos and Townhouses - The single-family home isn’t obsolete, yet. But the aging of the baby boomers could reshape the U.S. housing market and economy in the coming years. As the boomers get older, many will move out of the houses where they raised families and move into cozier apartments, condominiums and townhouses (known as multifamily units in industry argot). A normal transition for individuals, but a huge shift in the country’s housing demand.Based on demographic trends, the country should see a stronger rebound in multifamily construction than in single-family construction, Kansas City Fed senior economist Jordan Rappaport wrote in the most recent issue of the bank’s Economic Review. Construction of multifamily buildings is expected to pick up strongly by early 2014, and single-family-home construction should regain strength by early 2015. “The longer term outlook is especially positive for multifamily construction, reflecting the aging of the baby boomers and an associated shift in demand from single-family to multifamily housing. By the end of the decade, multifamily construction is likely to peak at a level nearly two-thirds higher than its highest annual level during the 1990s and 2000s,” Mr. Rappaport wrote. In contrast, when construction of single-family homes peaks at the end of the decade or beginning of the 2020s, he wrote, it’ll be “at a level comparable to what prevailed just prior to the housing boom.” He says the shift from single-family homes to multifamily dwellings will have implications for fiscal policy (i.e. tax subsidies for homeownership), monetary-policy analysis and even local zoning codes. “Suburbs seeking to retain aging households may need to re-create a range of these urban amenities and enact some rezoning to encourage multifamily construction,” he said.
6 Castles That Cost Less Than An Apartment In NYC - With Russian, Chinese, and Argentinian (with a record low in the blue dollar today) money washing ashore (in USD or Bitcoin) under the Status of Liberty, the 'prices' of upscale apartments in New York City have simply exploded. We thought some context for this apparent 'price' vs 'value' discrepancy was useful... presenting 6 castles that cost less than an apartment in NYC (and given the number of bedrooms, not to mention moats, dungeons, vineyards, ramparts and drawbridges - dramatically less in terms of per-capita spend).
Reis: Apartment Vacancy Rate declined to 4.1% in Q4 2013, Expected to increase slightly in 2014 - Reis reported that the apartment vacancy rate declined in Q4 to 4.1% from 4.2% in Q3. In Q4 2012 (a year ago) the vacancy rate was at 4.6%, and the rate peaked at 8.0% at the end of 2009. Some data and comments from Reis Senior Economist Ryan Severino: Vacancy declined by 10 basis points during fourth quarter to 4.1%, in line with last quarter's 10 basis point decline. Over the last year the national vacancy rate has declined by 50 basis points, on par with the year‐over‐year rate from the last few quarters. The national vacancy rate now stands 390 basis points below the cyclical peak of 8.0% observed right after the recession concluded in late 2009. Shrugging off the typical seasonal weakness that is observed during the fourth quarter of calendar years, demand for apartments remained stout in the fourth quarter of 2013. The sector absorbed 50,728 units, the largest figure since the fourth quarter of 2010. For 2013, the sector absorbed almost 165,000 units, ahead of 2012 but below the incredibly robust demand of 2010 and 2011. Meanwhile completions during the third quarter were 41,683 units, the highest quarterly total in ten years since the fourth quarter of 2003 when the market delivered 41,995 units. As we have been warning for the last few quarters, supply growth is clearly on an upswing. Roughly 127,000 units were delivered during 2013. This is in line with the long‐term historical average level of completions and the highest annual total since 2009. Four years after the advent of a recovery in the apartment market, newly completed units continue to be absorbed. This graph shows the apartment vacancy rate starting in 1980. (Annual rate before 1999, quarterly starting in 1999). Note: Reis is just for large cities. New supply is finally coming on the market and the decline in the vacancy rate has slowed - and Reis is projecting a slight increase in the vacancy rate this year
Reis: Office Vacancy Rate unchanged in Q3 at 16.9% - Reis released their Q4 2013 Office Vacancy survey this morning. Reis reported that the office vacancy rate was unchanged at 16.9% in Q4. This is down from 17.1% in Q4 2012, and down from the cycle peak of 17.6%.There has been a pick up in demand, but construction has also increased - so the vacancy rate was unchanged. From Reis Senior Economist Ryan Severino: The national vacancy rate was unchanged during the fourth quarter at 16.9%. For 2013, the vacancy rate fell by just 20 basis points, 10 basis points worse than the market's performance in 2012. National vacancies remain elevated at 440 basis points above the sector's cyclical low, recorded in the third quarter of 2007 before the recession began that December. On new construction: Occupied stock increased by 8.521 million SF in the fourth quarter. This is an increase from the 7.641 million SF that were absorbed during the third quarter. However, this was largely due to a jump in completions. For the quarter, 9.126 million SF were completed, up from last quarter's 6.301 million SF. This dynamic between net absorption and construction held throughout the year. For 2013, quarterly net absorption averaged 7.042 million SF, a 67% increase from 2012's average of 4.225 million SF. For construction, the quarterly average was 6.471 million SF, a 108% increase from 2012's average of 3.110. On rents: Asking and effective rents both grew by 0.7% during the fourth quarter. This a reversal of the trend that we have observed in recent quarters with rent growth slowing gradually. Asking and effective rents have now risen for thirteen consecutive quarters. During 2013 asking rent grew by 2.1% while effective rent grew by 2.2%. This was somewhat better than 2012's performance when asking rents grew by 1.8% while effective rents grew by 2.0%. This graph shows the office vacancy rate starting in 1980 (prior to 1999 the data is annual).
Reis: Mall Vacancy Rates decline in Q4 -- Reis reported that the vacancy rate for regional malls declined to 7.9% in Q4, down from 8.2% in Q3. This is down from a cycle peak of 9.4% in Q3 2011. For Neighborhood and Community malls (strip malls), the vacancy rate was declined to 10.4%, down from 10.5% in Q3. For strip malls, the vacancy rate peaked at 11.1% in Q3 2011. Comments from Reis Senior Economist Ryan Severino: The national vacancy rate for neighborhood and community shopping centers declined by 10 basis points during the fourth quarter. This was a slight improvement versus last quarter when vacancy was unchanged, but more or less in line with the pace of improvement since the market began to recover two years ago. ... Vacancies for neighborhood and community centers now stand at 10.4%, down 30 basis points during 2013, and down 70 basis points from the historical peak vacancy rate of 11.1% which was recorded over two years ago, during the third quarter of 2011. Yet there are some modestly hopeful signs. Construction during the fourth quarter was the highest since the fourth quarter of 2011 while net absorption was the highest since the fourth quarter of 2007. [Regional] Malls continue to be the outperformers during the retail market recovery. As of the fourth quarter mall vacancies stand at 7.9%, down 30 basis points from the third quarter, down 70 basis points during 2013, and down 150 basis points from the historical high level reached during the third quarter of 2011.This graph shows the strip mall vacancy rate starting in 1980 (prior to 2000 the data is annual). In the mid-'00s, mall investment picked up as mall builders followed the "roof tops" of the residential boom (more loose lending). This led to the vacancy rate moving higher even before the recession started. Then there was a sharp increase in the vacancy rate during the recession and financial crisis.
Consumer Debt Grows at Slowest Pace in 6 Months - Americans’ nonmortgage debt grew in November at the slowest pace in six months, a sign consumers may have been cautious about spending during the holidays. Total consumer credit, which excludes real-estate loans such as mortgages, grew at a 4.8% annual rate in November from a month earlier, the Federal Reserve said Wednesday. That was slower than October’s 7% pace and the smallest increase since April. The weaker growth largely reflected consumers reining in credit-card borrowing. So-called revolving credit grew at a 0.6% rate in November, down from a sharp 5.6% rise in October. Nonrevolving credit, which largely reflects student and auto loans, continued to climb at a solid pace, though it too slowed from prior months. Such credit grew at a 6.4% pace in November after consistently rising above a 7% pace over the summer. Consumer credit can be a leading indicator of overall consumer spending, a key driver of the U.S. economy. Americans are generally willing to build credit-card debt more when they are confident about the economy and their own finances. Households have shored up their finances during the recovery, with average debt payments as a percentage of disposable incomes now at historically low levels. Other reports show households stepped up spending throughout the second half of 2013, though at a modest pace, as job growth picked up. A Commerce Department report last month showed consumer spending rose in November at the highest pace since June. But wage gains were weak, and many households cut into their savings.
95% Of Total Consumer Credit Lent In Past 12 Months Is For Student And Car Loans - Another month, another disappointment for all those who hope the consumer will finally "charge it." In November, consumer credit was expected to grow by $14.25 billion, instead it rose by $12.318 billion. However, it was once again the components that were key, because while $11.9 billion or the vast majority of November's credit growth was in the form of car and student loans (i.e., non-revolving), a tiny $458 million was for revolving, or credit card, purchases. That's the demand side. On the supply side, no surprises here, the bulk of credit creation continues to come from the Federal Government whose contribution can be seen on the chart below. In fact, if one excludes the contribution of the Federal government and compares how the current "expansion" matches to the last 11, well... instead of describing it see for yourselves: Finally, putting it all into perspective, of the total $178 billion in consumer credit expansion in the past 12 months, a tiny $9 billion, or just 5% of total, was to fund credit card purchases. The rest went - you guessed it - into purchases of cars and paying for tuition, for which GM and strateospheric college tuitions are most grateful. And that is the New Normal economy in a nutshell.
Holiday Shopper Traffic Tumbles 14.6% As Online Sales Miss Expectations - In today's instance we find that holiday retail sales, on which the punditry placed so much hope to finally show a recovering consumer, rose 2.7%, however offset by a plunge in store foot traffic, which tumbled by a whopping 14.6% according to ShopperTrak and wildly missing expectations of a 1.4% decline, a far cry from 2012's 2.5% increase. A big part of the drop was due to the shorter shopping period as retailers only had 25 days to encourage shoppers to spend compared to 31 days earlier, although an even bigger contributor was the pulling of holiday sales into November with early promotions starting at the earlest time in history. "Consumers took a break from shopping after Thanksgiving weekend, so retailers were pressured to offer deep discounts and promotions in the final week before Christmas to finish the holiday on a positive note," said ShopperTrak founder Bill Martin. Naturally the weather was also blamed with a "cold snap" invoked to explain why shoppers stayed away from stores. Still, since the drop in traffic did not result in an overall collapse in spending, this is hardly the full explanation. So ShopperTrak provided the following goalseeked justification: "It's a result of more and more technology in the hands of the consumer, which allows them to virtually window-shop." Reuters adds that many shoppers went online to make purchases, particularly during a spell of abnormally cold weather in many parts of the United States during the first two weekends of December.
Retail Sales Point To Continuing "Struggle Through" Economy - Yesterday, I discussed whether corporate fixed investment would indeed make a resurgence, as many analysts and economists are hopeful of, in 2014. In that article, I discussed the link between personal consumption expenditures and business capital investment. What is becoming clear is that, on an annualized basis, personal consumption is weakening which historically doesn't bode well for fixed investment. Yet, there are many hopes that the consumer will begin to ratchet up spending in the coming year which will drive economic growth above 3%. With these hopes in mind, I thought it would be interesting to look at a couple of different measures of more "real time" retail sales survey's to get a clearer trend of the consumer. Retail sales make up about 40% of PCE so, while not a complete picture of the consumer, it does give us some insight into their strength or weakness. This morning, the ICSC-Goldman Sachs weekly retail sales survey was released which showed a 50% decline in retail sales post the Christmas holiday. This is not surprising, of course, as the rush to buy Christmas gifts is complete and consumers have a short respite before the credit card statement arrives. However, while one week's worth of data doesn't tell us much, a look at the longer term trend is more revealing. Since the index is comprised of weekly data, which is extremely noisy, I have used a 3-month moving average of the annual percentage change to smooth the series going back to 1989.
Car sales missing - Averaging October’s govt shutdown reduced report with November’s bounce back approx = today’s Dec releases. So levelish sales for the quarter, and a leveling off in general post Jan tax hikes vs a prior multi year upward slope. (Reuters) – The top four automakers in the U.S. market missed December sales expectations, but 2013 will still easily be the best year for the industry since before the recession. General Motors Co said that the U.S. auto industry will have December U.S. auto sales at a 15.6 million-vehicle annualized selling rate, well below the 16 million vehicles expected by 27 economists surveyed by Thomson Reuters. The late December holiday season is generally one of the heaviest sales periods at U.S. auto dealerships.Sales that may have occurred in December were pulled ahead to November because of a late-month, four-day Thanksgiving weekend, said John Felice, head of sales at Ford Motor Co. December auto sales were also hampered by snowy and icy weather over parts of the country late in the month, said Chrysler spokesman Ralph Kisiel. Each month, auto sales are seen as an early indicator of consumer spending.
Weekly Gasoline Update: Regular Unchanged, Premium Up a Penny - It’s time again for my weekly gasoline update based on data from the Energy Information Administration (EIA). Rounded to the penny, Regular was unchanged and Premium rose a penny. Regular and Premium are down 45 cents and 39 cents, respectively, from their interim highs in late February of last year. According to GasBuddy.com, no state is averaging above $4.00 per gallon, and only Hawaii is averaging over $3.90. One state (Montana) is averaging under $3.00, unchanged from last Monday.
AAR: Record Intermodal Rail Traffic in 2013, Carloads down slightly - From the Association of American Railroads (AAR): Freight Rail Traffic for 2013 Saw Record Intermodal Growth, Slight Dip in Carloads The Association of American Railroads (AAR) today reported that U.S. rail traffic for 2013 saw record intermodal growth with a slight full year decrease in carloadings. U.S. rail intermodal volume totaled a record 12.8 million containers and trailers in 2013, up 4.6 percent or 564,276 units, over 2012. Carloads totaled 14.6 million in 2013, down 0.5 percent or 76,784 carloads, from 2012. Intermodal volume in 2013 was the highest on record, surpassing the record high totals of 2006 by 549,471 units. In 2013, 11 of the 20 carload commodity categories tracked annually by AAR saw increases on U.S. railroads compared with 2012. The categories with sizable gains were: petroleum and petroleum products, up 167,868 carloads or 31.1 percent; crushed stone, gravel and sand, up 81,023 carloads or 8.3 percent; motor vehicles and parts, up 41,166 carloads or 5.1 percent, and waste and nonferrous scrap, up 14,472 carloads or 9.1 percent. The commodities with the largest carload declines in 2013 compared with 2012 were: coal, down 256,751 carloads or 4.3 percent; grain, down 81,309 carloads or 8 percent, and metallic ores, down 37,068 carloads or 9.9 percent. However, excluding coal and grain, those U.S. rail carloads which are reflective of the economy were up 261,276 carloads or 3.4 percent in 2013 over 2012. This graph from the Rail Time Indicators report shows U.S. average weekly rail carloads (NSA). In December 2013, U.S. railroads originated a total of 1,078,903 carloads, down 0.9% (9,978 carloads) from December 2012 and an average of 269,726 per week. ... Blame coal. U.S. railroads originated 423,218 carloads of coal in December 2013, down 5.2% (23,159 carloads) from December 2012.. The second graph is for intermodal traffic (using intermodal or shipping containers): Intermodal traffic set a record in 2013 and finished strong in December: U.S. railroads originated 958,778 intermodal containers and trailers in December 2013, up 70,742 units (8.0%) over December 2012 and an average of 239,695 per week. That’s by far the highest weekly average for any December in history and is a fitting end to a great year for intermodal.
U.S. trade deficit shrinks more than expected as imports sink - The US international trade deficit shrank sharply in November, led by a drop in imports, government data released Tuesday showed. The trade shortfall fell to $34.3 billion in November, a decline of 12.9 percent from October, the Commerce Department said. The decline in the chronic US trade gap in goods and services with the rest of the world was much steeper than expected. The average analyst estimate was for a deficit of $40.4 billion. The department revised the October figure to $39.3 billion from the prior estimate of $40.6 billion. November exports rose 0.9 percent to a record $194.9 billion. Imports fell 1.4 percent to $229.1 billion amid a decline in oil prices. Imports of crude oil, which represent about 10 percent of total imports, dropped 10.8 percent in November to $21.4 billion.
U.S. Trade Deficit Hits Lowest Level in 4 Years -- The United States trade deficit, the dollar-value difference between American imports and exports, fell to $34.3 billion in November, the lowest level in four years, the Commerce Department said Tuesday. The decline in the deficit was due in part to an increase in exports, which are up 17% above their pre-recession peak and roughly 5% since November of 2012. The main driver of an increase in exports has been the recent boom in U.S. energy production, as petroleum exports reached a record high in November. Energy was also the driving factor behind a decline in imports, as petroleum purchases from abroad dipped to their lowest level since 201o. Export growth has been a main goal of the Obama administration, as he set out an ambitious goal of doubling U.S. exports between 2010 and 2014 to $3.2 trillion. Though it looks unlikely that that goal will be reached, export growth has been outpacing overall growth of the economy.
Trade Deficit decreased in November to $34.3 Billion - The Department of Commerce reported this morning: [T]otal November exports of $194.9 billion and imports of $229.1 billion resulted in a goods and services deficit of $34.3 billion, down from $39.3 billion in October, revised. November exports were $1.7 billion more than October exports of $193.1 billion. November imports were $3.4 billion less than October imports of $232.5 billion. The trade deficit was less than the consensus forecast of $39.9 billion. The first graph shows the monthly U.S. exports and imports in dollars through November 2013.Imports decreased, and exports increased in November. Exports are 17% above the pre-recession peak and up 5% compared to November 2012; imports are just below the pre-recession peak, and down about 1% compared to November 2012. The second graph shows the U.S. trade deficit, with and without petroleum, through November. The blue line is the total deficit, and the black line is the petroleum deficit, and the red line is the trade deficit ex-petroleum products. Oil averaged $94.69 in November, down from $99.96 in October, and down from $97.45 in November 2012. The petroleum deficit has generally been declining and is the major reason the overall deficit has declined since early 2012. The trade deficit with China decreased to $26.9 billion in November, down from $28.9 billion in November 2012. A majority of the trade deficit is related to China. Overall it appears exports are picking up a little again.
Trade Deficit Plummets on Oil Imports - The U.S. November 2013 monthly trade deficit plunged -12.9% from last month due to a massive drop in oil imports. While the press headlines blare November's $34.25 billion trade deficit is at a four year low, what they are not reporting is just last June the deficit also dropped suddenly and very close to this figure. Exports increased just 0.9% while imports dropped by -1.4%. Graphed below are imports and exports graphed and by volume, note the global trade collapse in 2009 due to the recession. Imports are in maroon and exports are shown in blue, both scaled to the left. This month's drop doesn't appear to be a global slowdown and has much more to do with a sudden decline in petroleum and fuel related imports. Oil or end use petroleum dropped -22.1% from last month to a $15.2 billion deficit. Petroleum related exports increased $700 million while imports decreased by -$3.6 billion. Crude oil by itself declined over -$2.5 billion in imports this month. The November trade deficit should help boost GDP as did June's plunge with Q2. We showed in this post how oil imports are becoming less and less of the total trade deficit, so this month's deficit plunge isn't really a surprise. A piece of bad news is an increasing deficit with advanced technology products. This month the deficit was $9.3 billion and shows how much offshore outsourcing has impacted advanced technology. Worse than that, instead of moving advanced technology manufacturing back to U.S. shores the plan is to reclassify the supply chain so these goods made abroad can be (wrongly) counted as U.S. products. Along with an increasing trade deficit in advanced technology products, this month saw a $1 1 billion increase in automotive related imports. The China trade deficit is still on track to hit yet another annual record and this month maintained it's highs with a not seasonally adjusted -$26.9 billion China trade deficit The China trade deficit alone was 52.5% of the not seasonally total goods deficit, on a Census accounting basis. The U.S. hit a new record annual 2012 $315 billion trade deficit. The 2013 the trade deficit with China to date is -$294 billion. This means if December's deficit is more than $21 billion, 2013 will be yet another new record.
November Trade Deficit Slides 13%, Lowest Since October 2009, Exports Rise To Record - Following October's disappointing bounce in the US trade deficit, it was only expected that the November data would come leaps and bounds ahead of the expected $40 billion print, instead sliding 12.9% to $34.3 billion from October's revised $39.3 billion - this was the lowest monthly trade deficit since October 2009. The delta was the result of a modest boost in exports, up $1.7 billion, to a record high of $194.9 billion, compounded by a more pronounced slide in imports, which were $3.4 billion less than October's $232.5 billion. Some other highlights: exports to China climbed to a record high (we certainly expect "matching" Chinese exports to the US to also rise to a record when reported next), while the US petroleum deficit was the lowest since May 2009 thanks to shale. Charting US Trade: Trade with some key trading partners:
- The goods deficit with China decreased from $28.9 billion in October to $26.9 billion in November. Exports increased $0.1 billion (primarily soybeans and corn) to $13.2 billion, while imports decreased $1.8 billion (primarily toys, games, and sporting goods and apparel) to $40.1 billion.
- The goods deficit with the European Union decreased from $14.3 billion in October to $10.1 billion in November. Exports decreased $0.2 billion (primarily artwork, antiques, stamps, etc. and organic chemicals) to $22.9 billion, while imports decreased $4.4 billion (primarily pharmaceutical preparations) to $33.0 billion.
- The goods deficit with Canada decreased from $2.8 billion in October to $1.5 billion in November. Exports decreased $1.3 billion (primarily petroleum products and automobiles) to $25.7 billion, while imports decreased $2.7 billion (primarily crude oil) to $27.1 billion.
A visual summary from Bloomberg:
Progress in Rebalancing - Manufacturing output is returning to pre-recession levels, exports are continuing to grow,and the trade balance is shrinking. Manufacturing output has risen more rapidly than output overall; to some degree this is unsurprising as manufacturing is highly procyclical. This graph indicates that real output in manufacturing has grown 8.8% more rapidly (cumulatively, in log terms) than GDP as of 2013Q3. This is not dissimilar to that experienced in the last two recoveries. However, exports have grown more rapidly than in the last recovery, which is notable given the general lackluster state of the world economy (Europe, China). Exports of goods is not quite the same as exports of value added, given vertical specialization (that is, exports incorporate imported inputs; see discussion here). However, the pattern is pretty clear. On the other hand, as confirmed in November's trade balance figures, US net exports as a share of GDP are increasing. Note that although net exports including petroleum imports and petroleum product exports are increasing markedly through 2013Q3, even excluding those items (the black line), we see a 2.2 ppts improvement relative to 2005Q4. Irwin/Wonkblog argues that fracking is a big part of the reason for the improvement in the trade balance. That's confirmed by Figure 3. But it's useful to keep in mind that of the 2.9 ppts improvement, 2.2 ppts comes from non-oil and non-oil-product trade. Looking forward, continued progress depends on the value of the dollar (which might pop up if the taper proceeds rapidly, or if there is a new sovereign debt crisis overseas), and the extent to which growth in East Asia is consumption based.
How a Plan to Help Curb Garment Factory Disasters In Bangladesh Died in the U.S. Senate ==Concerned it may undermine their own response to recent factory disasters and cost them business, U.S. clothing makers pressured the Senate to spike a provision in this year's military spending bill that would have promoted a plan to improve labor standards in Bangladesh. The measure, tucked into versions of the National Defense Authorization Act, would have required so-called exchange stores on military bases to give preferential treatment to suppliers that sign the Bangladesh Accord on Fire and Building Safety, a legally binding agreement between clothing brands, labor groups and non-governmental organizations in the wake of the Rana Plaza clothing factory collapse, which claimed 1,129 lives last year. The amendment was ultimately left out of the defense spending bill that recently landed on President Barack Obama's desk. For the provision's backers, the events on Capitol Hill made for a rare and disappointing turn of events. The measure survived a vote in the GOP-controlled House of Representatives in June, only to die later in the Democrat-controlled Senate, where such a labor-backed amendment would normally stand better odds.
ISM Says Happy New Year, Market Sells The News - Dow Jones and Bloomberg enthusiastically reported the headline seasonally adjusted ISM Purchasing Managers Index December reading of 57. The Journal noted that it was the 6th straight month of readings above 55. Bloomberg blared that growth in manufacturing would propel the US economy in 2014. At 2:30 PM NY time, four and a half hours after the news was posted, stocks were down 18 on the SPX. But don’t worry, the Fed is busy refilling the punchbowl. The drunk will revive. The manufacturing sector accounts for around 11% of the US economy. Data for the much larger services sector will be reported on Monday. That index was very strong in September, but retrenched in October and November. That index normally moves in the same direction as the manufacturing indicator, but with much less volatility. It will be interesting to see if it rebounds to the extend that manufacturing has in the short run. The actual unadjusted New Orders index component of the Manufacturing PMI is a good indicator of how the manufacturing sector is doing. This is the highest level in the unadjusted New Orders Index since December 2004. However, the ISM PMI is based on a survey of survivors in what has been a shrinking industry. The ISM merely surveys whoever is left each month and posted the results as a diffusion index of the survey participants. The index doesn’t reflect that there are fewer participants, who are also smaller in many cases. Neither the New Orders component or the overall PMI reflect the longer term trend of production.
US Factory Orders up on Planes, Business Spending - U.S. factories orders climbed in November, led by a surge in aircraft demand. And businesses stepped up spending on machinery, computers and other long-lasting goods, a sign of investment that could fuel economic growth. Factory orders rose 1.8 percent in November, the Commerce Department said Monday. That follows a 0.5 percent decrease in October. Orders received by manufacturers totaled a seasonally adjusted $497.8 billion in November, the highest level on records dating to 1992. Orders have increased 2.5 percent over the past 12 months.The improvements could signal accelerating growth in 2014. Americans are buying more cars and homes, increasing demand for steel, furniture and other goods. That has led factories to hire more workers, generating additional economic momentum.Still, overall economic growth remains modest by historical standards. And though factory orders have strengthened in recent months, their growth rate has slowed during the recovery from the 2008 financial crisis.A 21.8 percent jump in volatile aircraft orders drove the November gains. But orders rose in many other categories, a sign of strength at factories and confidence among companies. Core capital goods, a proxy for business investment, rose 4.1 percent. Economists watch this category because it excludes volatile orders for aircraft and defense equipment.
Factory Orders Jump by 1.8% for November 2013 - The Manufacturers' Shipments, Inventories, and Orders report shows factory new orders increased 1.8% for November. Without transportation equipment, new orders increased 0.6%. October showed a drop in factory orders by -0.5%. For Q4, factory orders are starting to shape up and the signs point to increased economic demand. The Census manufacturing statistical release is called Factory Orders by the press and covers both durable and non-durable manufacturing orders, shipments and inventories. Transportation equipment new orders increased 8.3% , but part of the increase is volatile aircraft new orders. Motor vehicles bodies & parts new orders increase by 2.4%, whereas nondefense aircraft new orders increased 21.8%. Core capital goods new orders shot up 4.1% for November after a -0.6% decrease in October. Core capital goods are capital or business investment goods and excludes defense and aircraft. This is the best news of this report and implies a positive GDP investment component for Q4 if core capital goods new orders do not plunge for December. Nondurable goods is having a rough time with a 0.3% increase which cancels out the -0.3% change in October. Manufactured durable goods new orders, increased 3.4% for November, yet in October durable goods new orders decreased by -0.7%. Durable goods new orders was only slightly revised to a 3.4% increase from the originally reported 3.5% jump. Shipments overall increased 1.0%, buoyed by machinery related shipments, which increased 4.3%. Nondurable goods shipments went positive, a 0.3% gain as petroleum shipments jumped by 1.4%. Core capital goods shipments jumped up by 2.7% and this is great news for economic growth. Core capital goods shipments go into the GDP calculation so the month's increase bodes well for Q4 GDP. Below is a graph of core capital goods shipments.
ISM Non-Manufacturing Index at 53.0 indicates slower expansion in December - The December ISM Non-manufacturing index was at 53.0%, down from 53.9% in November. The employment index increased in December to 55.8%, up from 52.5% in November. Note: Above 50 indicates expansion, below 50 contraction. From the Institute for Supply Management: December 2013 Non-Manufacturing ISM Report On Business® "The NMI® registered 53 percent in December, 0.9 percentage point lower than November's reading of 53.9 percent. This indicates continued growth at a slightly slower rate in the non-manufacturing sector. The Non-Manufacturing Business Activity Index decreased to 55.2 percent, which is 0.3 percentage point lower than the 55.5 percent reported in November, reflecting growth for the 53rd consecutive month, but at a slightly slower rate. The New Orders Index contracted after 52 consecutive months of growth for the first time since July 2009, when it registered 48 percent. The index decreased significantly by 7 percentage points to 49.4 percent, and the Employment Index increased 3.3 percentage points to 55.8 percent, indicating growth in employment for the 17th consecutive month and at a faster rate. The Prices Index increased 2.9 percentage points to 55.1 percent, indicating prices increased at a faster rate in December when compared to November. According to the NMI®, eight non-manufacturing industries reported growth in December. Despite the substantial decrease in the New Orders Index, respondents' comments predominately reflect that business conditions are stable." This graph shows the ISM non-manufacturing index (started in January 2008) and the ISM non-manufacturing employment diffusion index. This was below the consensus forecast of 54.8% and indicates slower expansion in December than in November.
ISM Non Manufacturing New Orders Collapse - After the ISM’s manufacturing new orders for December showed some life last week we had reason to expect a good report from the Non Manufacturing (services) sector. It didn’t happen. New orders for the services sector fell sharply. On an actual, not seasonally adjusted basis, the new orders survey was down a whopping 10 points year to year to 50.4. It was also a drop of 6.4 points from the November reading. That’s unheard of. December is almost always an up month. The previous worst December drop in the previous 10 years was -1.8 in December 2009, in the pits of the economic collapse. A 50 reading is the borderline between expansion and contraction. The current reading indicates an economy teetering between expansion and contraction. Data for the services sector is released a few days after the Manufacturing index each month. The actual reading for new orders in the manufacturing sector for December was 64, which was a huge jump over the year ago period. Such a gigantic divergence between Manufacturing and Non Manufacturing orders is unheard of. The manufacturing sector accounts for around 11% of the US economy. The services sector is everything else other than government, mining, and agriculture. The services index has been declining since a strong reading in September, with the 3 month decline culminating in collapse in December. The new orders component of the Non Manufacturing index normally moves in the same direction as the manufacturing indicator, but with much less volatility. That was not the case this month.
ISM Non-Manufacturing: Second Month of Slower Growth Than Expected - Today the Institute for Supply Management published its latest Non-Manufacturing Report. The headline NMI Composite Index is at 53.0 percent, signaling slower growth than last month's 53.9 percent. This is the second consecutive month of slower growth. Today's number came in below the Investing.com forecast of 54.5, which was close to the 54.6 consensus posted by Briefing.com. Here is the report summary:The NMI® registered 53 percent in December, 0.9 percentage point lower than November's reading of 53.9 percent. This indicates continued growth at a slightly slower rate in the non-manufacturing sector. The Non-Manufacturing Business Activity Index decreased to 55.2 percent, which is 0.3 percentage point lower than the 55.5 percent reported in November, reflecting growth for the 53rd consecutive month, but at a slightly slower rate. The New Orders Index contracted after 52 consecutive months of growth for the first time since July 2009, when it registered 48 percent. The index decreased significantly by 7 percentage points to 49.4 percent, and the Employment Index increased 3.3 percentage points to 55.8 percent, indicating growth in employment for the 17th consecutive month and at a faster rate. The Prices Index increased 2.9 percentage points to 55.1 percent, indicating prices increased at a faster rate in December when compared to November. According to the NMI®, eight non-manufacturing industries reported growth in December. Despite the substantial decrease in the New Orders Index, respondents' comments predominately reflect that business conditions are stable. The chart below shows Non-Manufacturing Composite. We have only a single recession to gauge is behavior as a business cycle indicator.
Services ISM Misses, Slides To Lowest Since June; New Orders Records First Contraction After 52 Months Of Growth --First it was the Manufacturing ISM posting its first drop since September, and now it was the Services ISM's turn to not only record its second miss to expectations (of 54.5) in a row, but drop from 53.9 to 53.0, for the lowest print since June. However, the most notable development in today's release in addition to the slide in Inventories from 54.0 to 48.0 (impacting Q4 GDP) was the tumble in New Orders down from 56.4 to 49.4 - back to contraction territory: this was the first contraction in the New Orders index since July 2009 after 52 consecutive months of growth. Is it time to start worrying about the Untaper yet? Is the spike in economic activity in Q3 now over:
ISM NMI 53.0% Shows Service Sector Slides As New Orders Plunge The December 2013 ISM Non-manufacturing report shows the overall index decreased by -0.9 percentage points, to 53.0%. The NMI is also referred to as the services index and the decrease indicates slower growth for the service sector. New orders just plunged, by -7.0 percentage points, and went into contraction. So did inventories as well as order backlogs stayed in contraction. This is the lowest new orders has been since July 2009, the height of the recession. Generally speaking it seems the service sector is truly slowing down, a negative counter to the manufacturing sector. The comments from survey respondents quotes three as claiming their businesses are steady. One said severe weather has hampered business and another said Obamacare is probably going to slam them, but how exactly is unknown. Wholesale trade and information said business is picking up for them. Generally speaking a value above 50 for NMI indicates growth, below 50 indicates contraction. The below table shows the ISM non-manufacturing indexes. Below is the graph for the non-manufacturing ISM business activity index, or current conditions, what we're doin' now meter. Business activity declined and one survey respondent comment said customer released orders on hold, which is quite an ominous statement. One said customer spending was simply down. Here is the ISM's ordered services sector business activity list: The industries reporting growth of business activity in December — listed in order — are: Management of Companies & Support Services; Retail Trade; Finance & Insurance; Public Administration; Utilities; Information; Construction; Accommodation & Food Services; and Professional, Scientific & Technical Services. The industries reporting decreased business activity in December — listed in order — are: Mining; Arts, Entertainment & Recreation; Transportation & Warehousing; Educational Services; Real Estate, Rental & Leasing; and Wholesale Trade.
Vital Signs: Demand for Services Stumbles - The nonmanufacturing sector unexpectedly downshifted in December, according to the Institute for Supply Management. The big worry is a sharp falloff in demand. The ISM’s non-manufacturing purchasing management index slowed to 53.0 in December from 53.9 in November, in contrast to the acceleration to 54.4 expected by economists. Comments by respondents suggested the weather and holidays may have contributed to some year-end softness. The details in the report that covers mainly services raise some concern. Specifically, the new orders index continues to weaken since hitting a robust 60.5 in August. The December index dropped to 49.4 from 56.4 in November. The ISM said it was the first contractionary reading since July 2009. The backlog of orders also deteriorated, suggesting pent-up demand for non-manufacturing products is dwindling. The report did show an acceleration in jobs, with the employment index bouncing back to 55.8 after it dropped to 52.5 from 56.2 in October. If order books do not fill up again, however, the employment index could slow in early 2014.
ISM Indexes and BLS Employment Report - Every month I post an employment preview, and two of the data points I use are the ISM manufacturing employment index, and the ISM non-manufacturing employment index. In the monthly preview, I mention the historical correlation.Here are two scatter graphs showing the relationship between the ISM employment indexes for manufacturing and service, and monthly changes in BLS payroll employment. This graph shows the relationship between the ISM manufacturing employment index and the change in BLS manufacturing employment (as a percent of the previous month employment). The yellow dot is a forecast for December based on the ISM employment reading of 56.9. This suggests about 18,000 manufacturing jobs added in December (although there is plenty of noise, and R-squared is 0.63. This is also noisy (R-squared is 0.68), but a reading of 55.8 suggests an increase of about 227,000 service sector payroll jobs in December (blue dot on graph). So the ISM reports suggests private sector job growth in December of around 245,000.
Outsourcing Pays Big to Private Companies While Americans Suffer - Remember how outsourcing was shoved down the throats of the American people by claiming it would save money and was more efficient? Guess what, not only is costing more, the services now provided are dismal failures. A new report, Out of Control describes the abysmal state and consequences of outsourcing public services. Not only did America lose these jobs in many cases, taxpayers have lined the pockets of private enterprises while receiving less and paying more.The report goes through a litany of examples to show privatization of public services leaves little accountability and opens avenues to skirt public disclosure This is in addition to charging more for receiving less. Through contract law, many local and State governments cannot even fire these private enterprises and must guarantee payment even when the contracted services are negligent or non-existent. Probably the most egregious report example is the systemic endorsement of child abuse by using a for profit, private contractor for foster homes. Notice in the below description nothing happened to investigate or cancel the privatization contract until the business failed to file financial forms. Meanwhile a host of kids are emotionally scarred for life. Los Angeles County continued to annually renew a foster care services contract with an outfit called Wings of Refuge. Despite the aspirational name, multiple reports surfaced of children placed in homes where they experienced severe abuse, including cases in which children were beaten and locked in their rooms for days. For years Los Angeles County’s Department of Children and Family Services renewed the company’s $3 million annual contract, making it one of the largest private foster care providers in the county, responsible for thousands of vulnerable children. The county only canceled its contract after the contractor failed to file required financial forms for three years, had accumulated $458,000 in delinquent payroll taxes and was more than $2 million dollars in debt, according to licensing records. Los Angeles County admits that foster care contractors are only audited once a decade and audits can take years to complete, and carry little or no punishment.
Selling social media clicks becomes big business (AP) — Celebrities, businesses and even the U.S. State Department have bought bogus Facebook likes, Twitter followers or YouTube viewers from offshore “click farms,” where workers tap, tap, tap the thumbs up button, view videos or retweet comments to inflate social media numbers. Since Facebook launched almost 10 years ago, users have sought to expand their social networks for financial gain, winning friends, bragging rights and professional clout. And social media companies cite the levels of engagement to tout their value. But an Associated Press examination has found a growing global marketplace for fake clicks, which tech companies struggle to police. Online records, industry studies and interviews show companies are capitalizing on the opportunity to make millions of dollars by duping social media. For as little as a half cent per each click, websites hawk everything from LinkedIn connections to make members appear more employable to Soundcloud plays to influence record label interest. “Anytime there’s a monetary value added to clicks, there’s going to be people going to the dark side,”
It's A Click Farm World: 1 Million Followers Cost $600 And The State Department Buys 2 Million Facebook Likes - Recently, Facebook got into hot water with investors when it was revealed that as many of its 1.18 billion active users 14.1 million (and likely orders of magnitude more) were fraudulent. Things are even worse at Twitter, where Italian security researchers found that of the social network's 232 million monthly active users about 20 million are fake and for sale, while Barracuda Labs said 10% of more of all Twitter accounts are fake. Welcome to the world of click farms, where nothing is what it seems, and where social networking participants spend millions of dollars to appear more important, followed, prestigious, cool, or generally "liked" than they really are. Social networking has been the "it" thing for a while: for the networks it makes perfect sense because they are merely the aggregators and distributors of terrabytes of free, third party created content affording them multi-billion dollar valuations without generating a cent in profits (just think of the upside potential in having 10 times the world's population on any given publicly-traded network), while for users it provides the opportunity to be seen, to be evaluated or "liked" on one's objective, impartial merits and to maybe go "viral", potentially making money in the process. Of course, the biggest draws of social networks also quickly became their biggest weaknesses, and it didn't take long to game the weakest link: that apparent popularity based on the size of one's following or the number of likes, which usually translates into power and/or money, is artificial and can be purchased for a price. But it is not only sport stars with chips on their shoulder, or fading movie and music gods who are willing to dish out in order to get the fake adoration and fake fans: as the AP reports, In 2013, the State Department, which has more than 400,000 likes and was recently most popular in Cairo, said it would stop buying Facebook fans after its inspector general criticized the agency for spending $630,000 to boost the numbers. In one case, its fan tally rose to more than 2.5 million from about 10,000. Various other, more expected account "paddings" come from a recent check on Facebook showed Dhaka was the most popular city for many, including soccer star Lionel Messi, who has 51 million likes; Facebook's own security page, which has 7.7 million likes; and Google's Facebook page, which has 15.2 million likes.
Do Economists Understand How Power Shapes the Labor Market? - It was a great pleasure to read one of Paul Krugman’s columns over the holidays, entitled "The Fear Economy." I’d say it’s my favorite of 2013 because he took a decided step away from standard orthodox theory. Even Krugman rarely does that. His welcome and thankfully influential liberal ideas usually fall well within the scope of mainstream theory. Krugman talked about “power” in the labor market. When there aren’t enough jobs around, workers lose their bargaining power, he wrote, and they can’t maintain decent wages. This was a major statement by a Nobel winner. Why? Well, the typical reader might say, “Of course there is power in the labor market. And unless there are labor unions or a low unemployment rate, the power belongs to the employer to set wages and hire and fire. What else is new?" But if you were an economist, odds are you wouldn’t say this. Power plays a peripheral role, if any at all, in conventional economics. What does Krugman think? “Now, you may believe that employment is a market relationship like any other — there’s a buyer and a seller, and it’s just a matter of mutual consent,” he wrote in a blog post a few days earlier on the same subject (in which he nicely referenced the Roosevelt Institute’s Mike Konczal). “You may also believe in Santa Claus.” Apparently most orthodox economists believe in Santa Claus. They claim workers are paid what they deserve, just as businesses pay the going price for copper or software. That price is reached fair and square through competition. If more workers are needed to produce the goods and services demanded in the economy, their price—that is, their wage-- goes up. But if fewer workers are needed, their price goes down.
Weekly Initial Unemployment Claims decline to 330,000 - The DOL reports: In the week ending January 4, the advance figure for seasonally adjusted initial claims was 330,000, a decrease of 15,000 from the previous week's revised figure of 345,000. The 4-week moving average was 349,000, a decrease of 9,750 from the previous week's revised average of 358,750. The previous week was revised up from 339,000. The following graph shows the 4-week moving average of weekly claims since January 2000. The dashed line on the graph is the current 4-week average. The four-week average of weekly unemployment claims increased to 349,000.
Jobless Claims At Five-Week Low - Jobless claims fell last week, settling at the lowest level since late-November. The news follows yesterday’s encouraging employment report from ADP. Taken together, the data suggest that tomorrow’s December payrolls report from the Labor Department will also offer more support for thinking that economic growth is picking up. Meantime, new filings for unemployment benefits fell 15,000 last week to a seasonally adjusted 330,000. The drop was enough to pull down the four-week moving average for claims—the first decline since the week through November 30. A stronger signal that the labor market is healing can be seen in the year-over-year decrease in new claims, which fell nearly 12% last week vs. the year-earlier level. Here too we have the biggest retreat since late-November.
Vital Signs: For 2013, the Fewest Pink Slips Since 1997 - In another sign of improving labor markets, businesses announced only 30,623 job cuts in December, the lowest number in more than 13 years, according to a report by Challenger, Gray & Christmas. The drop in pink slips isn’t just a one-month phenomenon. The report says layoffs have been dwindling for most of the year. For all of 2013, only 509,051 layoffs were planned, says Challenger, the lowest number since 1997. While total job-cut reports are down 3% from 2012, some industries experienced large jumps in layoffs. The financial industry led all major sectors with almost 61,000 workers let go, up 49% from 2012. The healthcare industry followed with about 53,000 job cuts, up 45%. The report points out the increase in layoffs in the financial sector is actually a result of the improving economy and housing recovery. Lenders “shed the thousands of extra workers brought on to handle foreclosures as well as the refinancing of troubled mortgages. As the economy improved, the number of foreclosures and troubled mortgages decline,” said John Challenger, CEO of Challenger, Gray & Christmas. Job cuts are one side of the churning in the labor markets. The decline, echoed by the decline in new filings for jobless benefits during 2013, shows demand has been strong enough that most companies are at least maintaining their current staffing levels. In 2014, gross hiring has to pick up to push the net change in payrolls to a higher plane.
Job Search: December Saw Best Private Sector Gains in a Year - The private sector in the U.S. added 238,000 in December, the strongest growth in more than a year, payroll company ADP said Wednesday in its monthly estimate. The report, which was issued in collaboration with Moody’s Analytics, showed that small businesses with fewer than 50 employees had a particularly brisk month of hiring, adding 108,000 jobs — the most since the beginning of 2012. The report also underscores the nascent recovery in the construction sector, which added 48,000 jobs in December, the most since 2006. Mark Zandi, chief economist with Moody’s Analytics, lauded the numbers, saying “the job market ended 2013 on a high note.” “Job gains are broad-based across industries, most notably in construction and manufacturing,” Zandi said. “It appears that businesses are growing more confident and increasing their hiring.”
ADP: December's Job Growth Is The Highest For 2013 - The pace of job creation in the private sector accelerated last month, according to the ADP National Employment Report. The 238,000 increase (seasonally adjusted) at 2013’s close marks the third monthly rise above 200,000 and the biggest advance in more than a year. The upbeat news implies that Friday’s payrolls release from the US Labor Department for December will also compare favorably with recent history. “The job market ended 2013 on a high note,” says Mark Zandi, chief economist of Moody’s Analytics, which produces the employment report with ADP. “Job growth meaningfully accelerated and is now over 200,000 per month. Job gains are broad-based across industries, most notably in construction and manufacturing. It appears that businesses are growing more confident and increasing their hiring.” The next question: Are businesses also less inclined to lay off workers? Tomorrow’s weekly update on initial jobless claims will offer a clue. There’s some mildly bullish movement on this front lately, with new filings for unemployment benefits dropping in each of the past two weekly reports. If tomorrow’s news extends the trend, the case for optimism will strengthen further as we await Friday’s news from Washington.
ADP: Private Employment increased 238,000 in December -- From ADP: Private sector employment increased by 238,000 jobs from November to December, according to the December ADP National Employment Report®. ... The report, which is derived from ADP’s actual payroll data, measures the change in total nonfarm private employment each month on a seasonally-adjusted basis. Mark Zandi, chief economist of Moody’s Analytics, said, "The job market ended 2013 on a high note. Job growth meaningfully accelerated and is now over 200,000 per month. Job gains are broad-based across industries, most notably in construction and manufacturing. It appears that businesses are growing more confident and increasing their hiring.” This was above the consensus forecast for 205,000 private sector jobs added in the ADP report. Note: ADP hasn't been very useful in directly predicting the BLS report on a monthly basis, but it might provide a hint..
ADP Reports 238,000 Private Sector Job Growth for December 2013 - ADP's proprietary private payrolls jobs report gives us a monthly gain of 238,000 private sector jobs for December 2013 and November was revised upward to 229 thousand. This is the strongest growth for the year and might indicate America is finally seeing some real job creation. This report does not include government, or public jobs. While the official BLS employment report and ADP most often do not match on the monthly private payrolls figure, this still is a very positive report for jobs. Delving deeper into ADP's report, jobs gains were in the service sector were 170,000 private sector jobs. The goods sector gained 60,000 jobs. For the year, the goods sector has added 286,000 jobs with 75% of these being in construction. Construction was hammered by the housing bubble so finally these jobs appear to be returning. Professional/business services jobs grew by 53,000, the largest gain this year. Trade/transportation/utilities showed the strongest growth with 47,000 jobs. Financial activities payrolls gained 10,000 jobs. For the year services has gained 1.9 million jobs. While the annual jobs gains sound great, it still isn't enough to really recover payrolls from the great job slaughter of the recession. Construction work, part of the goods sector, gained 48,000 jobs. This is the highest growth in construction jobs since 2006. Manufacturing is finally adding some jobs and this month gained 19,000. Graphed below are the month job gains or losses for the five areas ADP covers, manufacturing (maroon), construction (blue), professional & business (red), trade, transportation & utilities (green) and financial services (orange). ADP reports payrolls by business size, unlike the official BLS report and this month growth was across the board. Small business, 1 to 49 employees, fueled the private payroll gains by adding 108,000 jobs with establishments having less than 20 employees adding 55,000 of those jobs. Additionally 28 thousand of these jobs were in the goods sector, which typically has higher wages. This is the strongest growth in small business jobs since early 2012. ADP counts businesses with one employee in there figures. Medium sized business payrolls are defined as 50-499 employees, added they added 59,000 jobs. Large business added 71,000 to their payrolls. If we take the breakdown further, large businesses with greater than 1,000 workers, added 74,000 of those large business jobs, which means businesses with 500 to 999 employees shed jobs by -3,000. Below is the graph of ADP private sector job creation breakdown of large businesses (bright red), median business (blue) and small business (maroon), by the above three levels. For large business jobs, the scale is on the right of the graph. Medium and Small businesses' scale is on the left.
ADP Payrolls Add 238K Jobs In December On Construction Surge, Highest Print Since November 2012 -- Unless ADP is forced to revise its December print following the BLS report on Friday (which in keeping with the baffle with BS tradition should be a major disappointment), the Fed will have no choice but to taper by another $10 billion at the next opportunity, because moments ago ADP, which for all intents and purposes is merely noise until it has revised its data to comply with Nonfarm Payroll reports, announced that in December, some 238K jobs were added in the US, well above the 2300K expected, and the highest monthly print since November 2012. The primary driver for the above expectation surge were construction jobs, which added 48K in December, also the highest monthly print in over a year, while manufacturing jobs rose less than previously, adding 19K jobs in December. As ADP reports, over the course of 2013, goods-producers added 286,000 jobs. Nearly 75 percent of these gains came from construction as the housing recovery accelerated throughout 2013. Service-providing industries added 170,000 jobs in December, down slightly from an upwardly revised November figure of 182,000. The ADP National Employment Report indicates that professional/ business services contributed the most to growth in service-providing industries, adding 53,000 jobs. This was the largest gain in the industry in a year. Expansion in trade/transportation/utilities slowed slightly, adding 47,000 jobs in December. Private payrolls increased by nearly 1.9 million jobs in the service-providing industries in 2013. The bulk of this increase was split evenly between transportation/trade/utilities and professional/business services. Finance brought up the rear gaining just 59,000 in the last twelve months
Vital Signs: Private Employers Hit the Gas Pedal - Businesses added workers at a fast pace in December and across the entire fourth quarter, a positive sign for consumer spending and the economy as a whole. According to Wednesday’s jobs survey compiled by Automatic Data Processing and Moody’s Analytics, private companies added 238,000 jobs in December, the best showing since November 2012. The December gain caps off an acceleration in hiring in the fourth quarter. According to the ADP numbers, private hiring averaged 224,000 a month last quarter, compared to a 165,000 rate in the first nine months of 2013. Equally positive, the gains were widespread across most major industries. For instance, manufacturing experienced a small loss in jobs during the first three quarter of 2013, but factory hiring picked up to a monthly average of 18,000 in the fourth quarter. Mark Zandi, chief economist at Moody’s Analytics, thinks hiring in 2014 could average a monthly rate of 225,000. That would bring the unemployment rate down to 6.5% by year’s end.
Keeping Construction Statistics in Perspective -- The ADP National Employment Report for December showed one rather surprising data point that was totally unexpected as shown on this bar graph: You will notice that there was significant growth in the jobs created in the construction sector (in light green), in fact, the U.S. economy added a whopping 48,000 construction jobs between November and December 2013, accounting for 20 percent of the 238,000 total jobs added, beating manufacturing, trade/transportation/utilities and financial activities. This was the best month for construction workers since February 2006 and more than twice the rate of construction job growth in November when only 21,000 construction workers found themselves back at work. Admittedly, new residential construction in November 2013 was robust with 1,091,000 privately-owned housing starts taking place, up 29.6 percent from November 2012 and the highest rate since February 2008 when 1,103,000 new privately-owned housing starts took place as shown on this graph from FRED: While those statistics look positively rosy, here is a look back at historical housing starts: Over the 659 sample months from January 1959 to the present, on average, there were 1,458,000 housing starts, 33.6 percent higher than the number of starts in November 2013. It is also important to keep in mind that over the 54 year period from 1959, the population of the United States grew from 177,829,628to its current level of 317,336,000, an increase of 78 percent. Here's another way of looking at the housing start data; the 1,091,000 housing starts in November 2013 are only the 120th highest in the last 54 years, tied with April 1967 when the population of the United States was only 198,712,000!
After ADP, Forecasters Now Expect 200,000 Jobs Gain Friday - Economists raised their forecasts for Friday’s payrolls number after very strong jobs data out Wednesday capped a string of solid December economic reports.The median forecast of economists included in the Dow Jones Newswires survey now calls for a 200,000 increase in December payrolls, up from a 191,000 advance initially expected.The Labor Department will release its December employment report Friday morning. Nonfarm payrolls increased by 203,0000 jobs in November.A better-than-expected December gain in private-sector jobs reported by Automatic Data Processing and Moody’s Analytics pushed some forecasters to lift their payroll estimates. ADP said 238,000 private jobs were created last month, the best gain since November 2012 and better than the 200,000 expected by forecasters. After seeing the report, economists at Goldman Sachs, Deutsche Bank and MFR, among others, raised their forecasts. The changes were numerous enough to raise the median forecast for December nonfarm payrolls. Economists still think the December unemployment rate–which is derived from a survey separate from the payrolls data–will hold at 7.0%. Other forecasters who are sticking to their forecasts, including those at UBS and TD Securities, agree the ADP report offers some upside risk to Friday’s number. In the past, the ADP job numbers have had large misses as a predictor of nonfarm payrolls. But the latest ADP report isn’t the only positive sign for December hiring.
U.S. Economy Adds 74K Jobs, Rate Falls to 6.7 Percent — U.S. employers added a scant 74,000 jobs in December, the fewest in three years. The disappointing gain ends 2013 on a weak note and could raise questions about the economy’s recent strength. The Labor Department says the unemployment rate fell from 7 percent in November to 6.7 percent, the lowest level since October 2008. But the drop occurred mostly because more Americans stopped looking for jobs. The government counts people as unemployed only if they are actively searching for work. Stock futures fell after the report was released. The slowdown in hiring could cause the Federal Reserve to rethink its plans to slow its stimulus efforts. The Fed decided last month to cut back on its monthly bond purchases by $10 billion. It could delay further reductions until it sees evidence that December’s weak numbers were temporary. Cold weather may have slowed hiring. Construction firms cut 16,000 jobs, the biggest drop in 20 months. Still, December’s hiring is far below the average gain of 214,000 jobs a month in the preceding four months. But monthly gains averaged 182,000 last year, nearly matching the previous two years. The proportion of people working or looking for work fell to 62.8 percent, matching a nearly 36-year low. Many industries posted weaker gains or cut jobs. Health care cut 6,000 positions, the first cut in 10 years. That could raise questions about the impact of President Barack Obama’s health care reform. Transportation and warehousing cut a small number of jobs, suggesting shippers hired fewer workers for the holidays. Government cut 13,000.
Job growth weakest in 3 years; unemployment rate falls - NBC News.com: Job creation stumbled in December, with the U.S. economy adding just 74,000 positions even as the Federal Reserve voted to take the first steps in eliminating its stimulus program. The unemployment rate dropped to 6.7 percent, below economists' estimates and due primarily to continued shrinkage in the labor force. It was the weakest job creation in almost three years. Economists said the frigid weather might have had an impact. "I describe this as a weather-related clunker," He pointed to a 16,000 drop on construction jobs, which are mostly outdoors, versus a drop of 1,000 in transportation and warehousing. He added that the weather was pretty frigid in January, too, so it may take a couple of months before there's a clearer reading on the employment situation. Economists Mark Zandi and Austan Goolsbee said on CNBC the numbers likely will be revised higher in future counts. Economists had expected the U.S. economy to add 200,000 jobs in December, with the unemployment rate holding steady at 7.0 percent. That would fall just below the initially reported 203,000 jobs created in November. The step back in hiring in December is at odds with other employment indicators that have painted an upbeat picture of the jobs market. The data showed that 38,000 more jobs were added in November than previously reported.
December payrolls: +74,000, and unemployment rate at 6.7% -- A curious report. Consensus was for 197k. But the unemployment rate has contracted sharply. At pixel, markets were mighty confused. Here are the main bits from the report: The unemployment rate declined from 7.0 percent to 6.7 percent in December, while total nonfarm payroll employment edged up (+74,000), the U.S. Bureau of Labor Statistics reported today. Employment rose in retail trade and wholesale trade but was down in information. Household Survey Data: The number of unemployed persons declined by 490,000 to 10.4 million in December, and the unemployment rate declined by 0.3 percentage point to 6.7 percent. Over the year, the number of unemployed persons and the unemployment rate were down by 1.9 million and 1.2 percentage points, respectively. Establishment Survey Data: Total nonfarm payroll employment edged up in December (+74,000). In 2013, job growth averaged 182,000 per month, about the same as in 2012 (+183,000 per month). In December, job gains occurred in retail trade and wholesale trade, while employment declined in information. The eye-catching fall in the unemployment rate reflects a fall in the participation rate, with 347k people leaving the workforce in December. Full details here, along with notice of some substantial revisions to the labour data series coming soon.
December Employment Report: 74,000 Jobs, 6.7% Unemployment Rate - From the BLS: The unemployment rate declined from 7.0 percent to 6.7 percent in December, while total nonfarm payroll employment edged up (+74,000), the U.S. Bureau of Labor Statistics reported today. The number of unemployed persons declined by 490,000 to 10.4 million in December, and the unemployment rate declined by 0.3 percentage point to 6.7 percent. The change in total nonfarm payroll employment for October remained at +200,000, and the change for November was revised from +203,000 to +241,000. With these revisions, employment gains in October and November were 38,000 higher than previously reported. The headline number was well below expectations of 200,000 payroll jobs added. This graph shows the job losses from the start of the employment recession, in percentage terms, compared to previous post WWII recessions. The dotted line is ex-Census hiring. This shows the depth of the recent employment recession - worse than any other post-war recession - and the relatively slow recovery due to the lingering effects of the housing bust and financial crisis. Employment is less than 1% below the pre-recession peak. The third shows the unemployment rate. The unemployment rate decreased in December to 6.7% from 7.0% in November. The fourth graph shows the employment population ratio and the participation rate. The Labor Force Participation Rate decreased in December to 62.8% from 63.0% in November. This is the percentage of the working age population in the labor force.
BIG Employment Miss - From the BLS: The unemployment rate declined from 7.0 percent to 6.7 percent in December, while total nonfarm payroll employment edged up (+74,000), the U.S. Bureau of Labor Statistics reported today. Employment rose in retail trade and wholesale trade but was down in information. This is in comparison to the AP job report that printed at 238,000. Looking at the details, we see some very large holes in the jobs data. Retail +55,000 (Remember, the data is seasonally adjusted, so this takes the holiday hiring season into account). Professional employment increased 19,000 in comparison to a 2013 monthly average of 53,000 Other categories growth was equally paltry. Also consider the following hours worked data: The average workweek for all employees on private nonfarm payrolls edged down by 0.1 hour to 34.4 hours in December. The manufacturing workweek was unchanged, at 41.0 hours, and factory overtime edged up by 0.1 hour to 3.5 hours. The average workweek for production and nonsupervisory employees on private nonfarm payrolls edged down by 0.1 hour to 33.6 hours. Finally, there is the issue of the drop in the unemployment rate, which went from 7%-6.7%. The reason is the drop in the civilian labor force from 155,284,000 to 154,937,000. Put another way, expect to hear more about "people running from the US labor market." A final caveat from Bonddad: I've grown to give this monthly data point release less and less importance, instead focusing on the broader employment picture -- which is still miserable. However, from a practical side, this data point will move the markets because of the size of the miss and the fact it contradicts the "US economy is getting stronger" narrative we've been seeing over the last few months.
Big Miss: Nonfarm Payrolls +74,000 vs. 205,000 Expected; Unemployment Rate 6.7% as Labor Force Shrinks by 347,000 - Once again, the stats reveal much weakness.
- Big Miss: Nonfarm Payrolls rose by 74,000. The median forecast of 37 economists was 205,000 jobs according to USA Today.
- The civilian institutional population rose by 178,000 but the labor force declined by 347,000.
- Nonfarm payroll growth is the smallest number since January 2011.
Clearly, this is yet another bad report, with people dropping out of the labor force like mad. Amusingly, USA Today reports that "severe winter was the main culprit behind the disappointing job gains." Did economists not know it was cold outside when they gave USA today their estimates? I guess not. December BLS Jobs Statistics at a Glance:
- Nonfarm Payroll: +74,000 - Establishment Survey
- Employment: +143,000 - Household Survey
- Unemployment: -490,000 - Household Survey
- Involuntary Part-Time Work: +48,000 - Household Survey
- Voluntary Part-Time Work: -127,000 - Household Survey
- Baseline Unemployment Rate: -0.3 to 6.7% - Household Survey
- U-6 unemployment: +0.0 to 13.1% - Household Survey
- Civilian Non-institutional Population: +178,000
- Civilian Labor Force: -347,000 - Household Survey
- Not in Labor Force: +525,000 - Household Survey
- Participation Rate: -0.2 at 62.8 - Household Survey
Only 74K Jobs Added In December, Huge Miss To Expectations Of 197K: Weather Blamed - So much for the recovery. Moments ago December nonfarms were revealed at just 74,000 a huge miss to expectations of 197,000 - the biggest miss Since December 2009. The drop from last month's revised 226K was the largest since December 2010. Other notables: the change in private payrolls was a tiny 87K vs expectations of 200K. Mfg payrolls added just 9K vs 15K expected and down from 31K. Average hourly earnings for all employees rose 0.1% vs. Expected 0.2%. The good news: the unemployment rate plunged to 6.7% from 7.0%... For all the wrong reasons - the number of people not in the labor force rose to a record 91,808,000. As a reason for the plunge the BLS says there was a major weather effect seen on the forced part-time series, and notes the decline in healthcare which is rare and part of the sector slowing. Thank you Obamacare. And now bring on the Untaper. Some of the highlights from the report:The number of unemployed persons declined by 490,000 to 10.4 million in December, and the unemployment rate declined by 0.3 percentage point to 6.7 percent. Over the year, the number of unemployed persons and the unemployment rate were down by 1.9 million and 1.2 percentage points, respectively. (See table A-1.) Among the major worker groups, the unemployment rates for adult men (6.3 percent) and whites (5.9 percent) declined in December. The rates for adult women (6.0 percent), teenagers (20.2 percent), blacks (11.9 percent), and Hispanics (8.3 percent) showed little change. The jobless rate for Asians was 4.1 percent (not seasonally adjusted), down by 2.5 percentage points over the year. (See tables A-1, A-2, and A-3.) Among the unemployed, the number of job losers and persons who completed temporary jobs decreased by 365,000 in December to 5.4 million. The number of long-term unemployed (those jobless for 27 weeks or more), at 3.9 million, showed little change; these individuals accounted for 37.7 percent of the unemployed. The number of long-term unemployed has declined by 894,000 over the year. (See tables A-11 and A-12.)
Unemployment Rate 6.7% As Half Million More Not In Labor Force - The December current population survey unemployment report is just plain weird. First, the unemployment rate dropped another 0.3 percentage points to 6.7%, the lowest unemployment rate since October 2008. The unemployment rate dropped because over half a million people dropped out of the labor force. The unemployment rate's dramatic decline for 2013 is due primarily to people no longer being counted. The ranks of the employed has only increased 1.4 million over the past year while the population no longer part of the work force has swelled by almost three million. This article overviews and graphs the statistics from the Employment report Household Survey and frankly this report is simply not good news. The ranks of the employed did increase by 143,000, so this does imply some people obtained work, yet this is not nearly enough to justify the plunging unemployment rate above. The employed now tally 144,586,000. Those unemployed stands at 10,351,000, a -490,000 drop from last month and a main reason why the unemployment rate declined by -0.3 percentage points in a month. Below is the change in unemployed and as we can see, this number normally swings wildly on a month to month basis generally. A sudden drop in the ranks of the official unemployed does not necessarily mean those people found new jobs. Those not in the labor force shot up by 525,000 persons. The below graph is the monthly change of the not in the labor force ranks. Notice the increasing swells and wild monthly swings. These are not all baby boomers and people entering into retirement as we showed in this analysis of labor participation by age.
A Bizarre Jobs Report: Only 74K New Jobs, But the Unemployment Rate Drops to 6.7% - Here is the lead paragraph from the Employment Situation Summary released this morning by the Bureau of Labor Statistics:The unemployment rate declined from 7.0 percent to 6.7 percent in December, while total nonfarm payroll employment edged up (+74,000), the U.S. Bureau of Labor Statistics reported today. Employment rose in retail trade and wholesale trade but was down in information.... In 2013, job growth averaged 182,000 per month, about the same as in 2012 (+183,000 per month). Today's report of 74K new nonfarm jobs was dramatically below the Investing.com forecast, which was for 196K. And the unemployment rate of 6.7% was a surprising drop from the Investing.com expectation of unchanged at 7.0%. Contributing to today's month-over-month oddities is that fact that the December report includes updated seasonal adjustment factors applicable to data as far back as January 2009. The unemployment peak for the current cycle was 10.0% in October 2009. The chart here shows the pattern of unemployment, recessions and both the nominal and real (inflation-adjusted) price of the S&P Composite since 1948. Note the increasing peaks in unemployment in 1971, 1975 and 1982. The second chart shows the unemployment rate for the civilian population unemployed 27 weeks and over. This rate has fallen significantly since its 4.4% all-time peak in April 2010. The latest number is 2.5%, finally slipping below the previous peak in 1983. This measure gives an alternative perspective on the relative severity of economic conditions.The next chart is an overlay of the unemployment rate and the employment-population ratio. This is the ratio of the number of employed people to the total civilian population age 16 and over. The inverse correlation between the two series is obvious. We can also see the accelerating growth of women in the workforce and two-income households in the early 1980's. Following the end of the last recession, the employment population has three times bounced at 58.2% — a level that harkens back to the 58.1% ratio of March 1953, when Eisenhower was president of a country of one-income households, the Korean War was still underway, and rumors were circulating that soft drinks would soon be sold in cans.The latest ratio is 58.6%, which continues to be stuck in the narrow range (58.2% to 58.8%) since the end of the last recession. For a confirming view of the secular change the US is experiencing on the employment front, the next chart illustrates the labor force participation rate. To two decimal places we're at 62.8%, stuck at a nearly four decade low. Today's level was first seen in March 1978.
The BLS Report Covering December 2013: A Bad Report - The short story is this. In the Household survey, seasonally adjusted unemployment fell an incredible three-tenths of a percent to 6.7% in December. The labor force is around 155 million. 0.3% of that is around 450,000 workers. In fact, it was 490,000. Yet the Business survey reported, also seasonally adjusted, an increase of just 74,000 as compared to the upwardly revised November number of 241,000. How to explain this wild divergence in the seasonally adjusted data? The number of employed grew by 143,000 (still twice the number of jobs reported created) while the labor force shrank 347,000. Add these two number together and you get 490,000. It’s important to remember that the BLS uses a jobseeker definition for unemployment. If you are without a job and have not looked for one in the 4 weeks before the week in which the Household survey is conducted, you are not considered unemployed. You are considered to be out of the labor force. As a worker, you cease to exist. What happened in December is that a lot of workers ceased to exist. The unadjusted numbers tell a similar story, only more extreme. The seasonally unadjusted labor force declined by 638,000, with employment falling 352,000 and unemployment, 287,000. The decline in employment corresponds to a 246,000 decrease in the number of jobs seasonally unadjusted from the Business survey. This is a piss poor jobs report. The drop in unemployment is completely misleading. While December is not usually a stellar month, these numbers are worse than usual. Expectations in the markets were that this was going to be a gangbuster report. It was instead just a bust. This is a bad report.
December's Dismal Payrolls Mark Recession Six Year Anniversary - The BLS employment report shows total nonfarm payroll jobs gained were a paltry 74,000 for December 2013, with private payrolls adding 87,000 jobs. Government jobs decreased by -13,000. Worse, 40,400 of jobs gained were temporary ones. That's over half, 54.6%, of December's jobs were temporary. There is an another shadow cast over this report in that December is the 6th year anniversary from start of the great recession. The BLS employment report is actually two separate surveys and we overview the current population survey in this article. The better news is November's job gains were revised upward, by 38,000 to 241,000 jobs. The start of the great recession was declared by the NBER to be December 2007. The United States is now down -1.165 million jobs from December 2007, a full six years ago. EPI just performed an analysis showing America is really down 7.9 million jobs to return to pre-recession employment levels due to increased population growth over the last six years. Below is a bar chart showing the employer's payroll growth since January 2008. We see health care jobs, part of education and health sector, is the only real growth sector, along with very low paying restaurant jobs in leisure and hospitality. Professional and business includes waste management and many other low paying administrative types of jobs. Professional and business also hold the temporary jobs. Manufacturing has just been decimated, which had little to do with the housing bubble and financial crisis.
The Full-Time/Part-Time Employment Ratio Shows Little Improvement - Let's take a close look at today's employment report numbers on Full and Part-Time Employment. Buried near the bottom of Table A-9 of the government's Employment Situation Summary are the numbers for Full- and Part-Time Workers, with 35-or-more hours as the arbitrary divide between the two categories.The Labor Department has been collecting this since 1968, a time when only 13.5% of US employees were part-timers. That number peaked at 20.1% in January 2010. The latest data point, going almost four years later, is only modestly lower at 18.9%. Here is a visualization of the trend in the 21st century, with the percentage of full-time employed on the left axis and the part-time employed on the right. We see a conspicuous crossover during Great Recession. Here is a closer look since 2007. The reversal began in 2008, but it accelerated in the Fall of that year following the September 15th bankruptcy of Lehmann Brothers. In this seasonally adjusted data the reversal peaked in early 2010. Over three-and-a-half years later the spread has narrowed a bit, but we're a long way from returning to the ratio before the Great Recession. The two charts above are seasonally adjusted and include the entire workforce, which the CPS defines as age 16 and over. A problem inherent in using this broadest of cohorts is that it includes the population that adds substantial summertime volatility to the full-time/part-time ratio, namely, high school and college students. Also the 55-plus cohort includes a subset of employees that opt for part-time employment during the decade following the historical peak spending years (ages 45-54) and as a transition toward retirement. The next chart reduces the summertime volatility problem by focusing on the 25-54 workforce. Note that the government's full-time/part-time data for this cohort is only available as non-seasonally adjusted. To help us recognize the summer seasonality that remains, I've used a lighter color for the summer-month markers, which are the most subject to temporary shifts from part-time to 35-plus hours of employment. I've also included 12-month moving averages for the two series to help us identify the slope of the trend over the past three years.
Jobs Report: Deep Freeze in the December Jobs Market - Payrolls were up only 74,000 last month, the lowest job gain since January 2011 and suggestive evidence that the broader economic recovery has yet to reach the all-important job market. “Suggestive” because we don’t want to build too much into one month’s jobs report, especially when it bucks the recent trend. Remember, these numbers undergo revisions in coming months, so we’ll have to see is this sharp deceleration sticks. The unemployment once again fell—from 7% to 6.7%–but for mostly the wrong reason: people leaving the job market versus finding work. I’ll have more to say about the report throughout the day…one question is whether December’s report is distorted—biased down—by any obvious factors. The BLS commissioner mentioned unusually cold weather as one factor possibly driving down construction, which lost 13,000 jobs after averaging +10,000 per month last year. But nothing else jumped out at me (these figures are already adjusted for seasonal patterns, though if those patterns change the seasonal adjustments can take a while to catch up). In fact, employment growth was slow across most industries, and both surveys—these data come from both a survey of firms and of households—showed weaknesses, suggesting a much weaker than expected job market last month. Payrolls were up 2.2 million for the full year 2013, about the same as last year—an average of about 180,000 jobs a month. The labor force participation rate, which as mentioned also fell last month, is down 0.8 percentage points over 2013, a large loss in participation at this stage of an economic recovery. The unemployment rate fell from 7.9% in December of 2012 to 6.7% last month, a large annual decline in the jobless rate. But again, most of that fall was due to people leaving the labor force.
December Jobs Report Comes In Way Off Estimates, 300,000+ Leave Labor Force -- The past two months of Jobs Reports from the Bureau of Labor Statistics had shown what seemed to be good news, and perhaps signs that the jobs spigot on the economy was starting to open more than it had been in the past. October, which many had thought would be impacted adversely by the government shutdown, came in at a pre-revision number of 204,000 net jobs created, a number that was revised downward to 200,000, still a respectable number. November’s number came in at a seemingly healthy 203,000 net new jobs. These numbers, as well as previous good numbers going back to the summer and healthy Gross Domestic Product numbers, led many to believe that we’d see strong jobs growth in December, especially given the fact that it is typically a month when retailers and delivery services typically beef up their employment numbers for the Christmas season. The consensus forecast was for roughly 190,000 net new jobs, while the ADP report that came out, and which often diverges significantly from the official BLS numbers, showed 238,000 net new jobs created. As it turned out, though, the first round of numbers out regarding the labor market in December was way off estimates, and not in a good way: The United States economy created just 74,000 jobs in December, the slowest pace in three years, disappointing both economists and policy makers who had concluded that the labor market was finally gaining some sustained momentum.Experts had expected the economy would add just under 200,000 positions in December, and the huge shortfall also stood in sharp contrast with the overall pace of job creation in 2012 and 2013. In those years, employers added an average of 182,500 positions a month. Just last month, the Federal Reserve announced it would begin pulling back on its enormous stimulus program after several months of healthier job gains. But the latest data calls into question whether the central bank’s optimism was premature.The unemployment rate seemingly improved in December, falling to 6.7 percent from 7 percent in November. But there was a 0.8 percentage-point plunge in the labor participation rate, meaning that people were dropping out of the work force rather than finding new jobs.Although some sectors, like retailing, posted decent gains, other sectors that had been healthy during 2013 reversed course in December, significantly lowering the overall performance of the job market.
Big Drop in Unemployment Rate Is Not Good News - The U.S. unemployment rate dropped a whopping 0.3 percentage point to 6.7% in December but a broader measure of unemployment was unchanged at 13.1% as hundreds of thousands left the labor force. There was a small bit of good news in the report. The number of people employed jumped by a huge 143,000, meaning that more people got jobs last month. The problem is that the number is dwarfed by the 347,000 who dropped out of the labor force. Part of that is payback for a big jump in the labor force in November, but a big increase in the number of discouraged workers suggest that many people gave up looking for work last month. There were 917,000 people considered discouraged, meaning they aren’t actively looking for work but want a job, up from 762,000 in November. A broader unemployment rate, known as the “U-6″ for its data classification by the Labor Department, was flat last month, reflecting the rise in disaffected workers. That rate includes everyone in the official rate plus “marginally attached workers” — those who are neither working nor looking for work, but say they want a job and have looked for work recently; and people who are employed part-time for economic reasons, meaning they want full-time work but took a part-time schedule instead because that’s all they could find. The ranks of part-time for economic reasons rose slightly to 7.77 million, but a bigger increase came in the number of marginally attached workers. The number of people dropping out of the labor force is worrying to the economists and the Federal Reserve. The longer someone is out of work, the lower their odds become of ever finding steady work again. There are currently more than 18.7 million people out of work for more than six months. The participation rate, the labor force as a percent of the whole population, dropped to 62.8% in December, matching the October level that was the lowest since 1978 when large numbers of women were entering the work force for the first time. Congress is currently debating whether to continue extending unemployment benefits beyond the 26 weeks offered by most states. Some 1.3 million workers lost those benefits last month when the program expired. That happened after the December jobs numbers were put together. If the extension is not approved, many of those people could drop out of the labor force this month, further sinking the participation rate.
Three Bad Signals in the December Jobs Report - 7 graphs - Anemic job growth, declining labor force participation and declining average weekly hours of work all point to a labor market the continues to struggle for good omens. The comment from the BLS Employment Situation for December is that total nonfarm payroll employment “edged” up +74,000. Evidently the synonym for edge is “barely increased at all and was much lower than anticipated.” See the first estimate in the Net Employment Change chart. The Establishment data shows employment for November was revised up from 203,000 to 241,000, while the final estimate for October employment remained at 200,000. Wrapping up 2013, job growth averaged 182,000 per month, almost exactly the same as in 2012 (183,000 per month). Private employment was up +87,000 while Government jobs declined by -13,000. The largest gains overall came in Private Service Producing, +90,000; with Retail (+55,300) and Wholesale (+15,400) Trade leading the way. Construction employment fell -16,000. The Household Survey indicates that the combination of a decline in the labor force -347,000 (also a decline in the labor force participation rate to 62.8 from 63.0), and a decrease in the number of people unemployed, -490,000, gave rise to a decline in the unemployment rate to 6.7% from 7.0%. The unemployment rate one year ago was 7.9%. So, while this bellwether statistic has shown marked improvement over the past twelve months, the labor market still seems troubled. Initial claims have bounced. Of course, the extremely cold weather throughout much of the country has certainly affected many of the variables in question over the past month.The average lenght of the work week declined slightly and average earning in crease by 1.8% – less than in recent months.
Debating Why the Work Force Is Shrinking - People keep leaving the labor force. The share of Americans either working or looking for work sank to 62.8 percent in December, tying October for the lowest level since 1977 – an era when women were much less likely to work. One explanation is that baby boomers are shuffling into retirement. The trend is demographic rather than economic. People are not working because they are old. Another explanation is that people have abandoned hope of finding jobs. Both explanations are true for some people. What we don’t know are the proportions. We don’t know how many of the people who have stopped looking for work might want to return to the ranks of working adults as the economy rebounds. Economic forecasts from before the recession are a potentially valuable source of insight. The demographic trends, after all, were relatively easy to predict. The number of baby boomers is stable – or at any rate, it does not increase. It is therefore striking that in 2005, when the labor force participation rate stood at 66 percent, the Bureau of Labor Statistics predicted that the rate would fall only a bit to 65.6 percent by 2014 – far above the current rate of 62.8 percent. Recent studies, including a much-discussed paper by a pair of Federal Reserve economists working at the International Monetary Fund, have similarly concluded that the recession is the primary cause of the decline in the labor force. As is often the case in economics, however, the truth has proven elusive. Why are answers so hard to find? In part because the data is subject to multiple interpretations. Those who say they’ve retired may mean that they never want to work again, or they may be taking shelter in the dignity of retirement because they can’t find work – and they might be willing, even eager, to reconsider.
Under the weather - 13 months ago, the Hurricane Sandy jobs report was released — the one for November 2012. Analysts were bracing themselves: a lot of people hadn’t been able to work that month, due to bad weather. But in the end, the report was not that bad: 146,000 new jobs were created in the month, and the unemployment rate nudged down to 7.7%. Markets, which had been expecting a mere 80,000 new jobs, were positively surprised. This month, the story is the exact opposite. Yes, we knew there was bad weather in December, but no one expected it to have a huge impact on job creation. And yet the actual jobs report for the month is a huge disappointment: there were just 74,000 new jobs created, and the labor participation rate fell sharply yet again. On top of that, substantially all of the jobs which were created were in low-wage sectors. Once you take into account the weather, however, the December report wasn’t that bad. A whopping 273,000 people were counted as “Employed – Nonagriculture industries, Bad weather, With a job not at work”, which is to say that they did not get counted in the payrolls figures even though they’re employed. Most of the time, that number is in the 25,000 to 50,000 range, and although it always spikes in the winter, this was the worst December for weather-related absence from work since 1977. None of this is an exact science. The January 2011 jobs report, for instance, showed a weak gain of 36,000 in the headline payrolls number — but would have looked insanely strong if you added in the 886,000 people who couldn’t get to work, and weren’t paid, because of the snowstorms that month. That’s not just bigger than this month’s figure of 273,000; it’s also vastly bigger than the Hurricane Sandy figure of 369,000 in November 2012. And sometimes the numbers can be much bigger still: the record was set in January 1996, when 1,846,000 people were kept off payrolls by stormy weather, and the headline number on the employment report was a negative 201,000.
Did The December Cold Affect Today’s Jobs Report? -- Did December’s cold weather help deliver this morning’s disappointing jobs report? It’s possible. According to the Bureau of Labor Statistics’ (BLS) monthly report, the economy only added 74,000 jobs in December — a let down from an expected addition of 196,000. BLS gathers the data by surveying the economy during the week that includes the 12th day of the month. If severe weather prevents workers from coming to their jobs for the entire week, they aren’t counted as “on payroll,” which reduces the number of jobs counted in the economy. As Steven Perlberg at Business Insider notes, the week including December 12, 2013 saw nationwide temperatures about five and a half degrees lower than normal. And cold weather can prevent people from getting work by shutting down road, air, or train travel. The caveat is that some economists think cold plus precipitation is what really drags down the numbers. According to data from the National Oceanic and Atmospheric Administration, the December survey period was relatively dry. But then December as a whole saw about 21 percent more snowfall than usual. BLS also does a survey of households as well as a survey of businesses. And today’s household numbers found that 273,000 Americans reported having a job but not being at work because of the weather. Because the two survey’s methodologies don’t overlap, the business numbers — and thus the jobs numbers — could very well have counted those 273,000 as not on payroll at all. Finally, it’s worth noting that each monthly jobs report is a preliminary pass at the data, and BLS will revise its numbers in the coming weeks and months.
Today's jobs report: a wake-up call or an aberration? - Today's payrolls shocker (see story) sent treasury yields sharply lower. As discussed last month (see post), speculative investors have piled into the market and were forced to cover their shorts after the jobs report. Going forward, until there is more visibility on the labor markets, investors will be more cautious shorting treasuries. The shape of the treasury curve move has become fairly predictable, with the "belly" experiencing the largest moves (see post). Now comes the debate on whether this jobs report was a fluke. LA Times: - Analysts were shocked by Friday's Labor Department report that the economy added just 74,000 net new jobs in December, about one-third what many had forecast. The bad weather in parts of the country last month apparently played a role, and there were unusually big payroll drops in the movie industry and at accounting firms. Still, that doesn't fully explain why the hiring was so weak. The healthcare sector was flat, as was transportation and warehousing, for example. On the whole, job growth was not only the lowest in almost three years, it was incongruous with the latest string of positive economic data -- on exports, homebuilding, consumer spending -- indicating an economy and job market gathering steam. Is this a wake-up call on more weakness in the US labor markets or simply an aberration? Thoughts, comments?
Sharp Drop in Unemployment Due to People Leaving the Labor Force - Dean Baker - The headline unemployment rate fell sharply to 6.7 percent in December. However, this is not good news. The drop was almost entirely due to people leaving the labor force as the number of people reported employed in December only rose by 143,000, just enough to keep the employment-to-population ratio constant. Blacks disproportionately left the labor market, with the labor force participation rate for African Americans dropping by 0.3 percentage points to 60.2 percent, the lowest rate since December of 1977. The rate for African American men fell 0.7 percentage points to 65.6 percent, the lowest on record.The data on the establishment side was not any brighter with the survey reporting an increase of just 74,000 jobs. Some of this weakness was due to unusually slow growth in health care and restaurant employment. This is likely an anomaly that will be reversed in future months. However, there was also a decline in the index of average weekly hours. This suggests that the economy may be weaker than some of the more recent optimistic accounts indicated.
People Not In Labor Force Soar To Record 91.8 Million; Participation Rate Plunges To 1978 Levels - Curious why despite the huge miss in payrolls the unemployment rate tumbled from 7.0% to 6.7%? The reason is because in December the civilian labor force did what it usually does in the New Normal: it dropped from 155.3 million to 154.9 million, which means the labor participation rate just dropped to a fresh 35 year low, hitting levels not seen since 1978, at 62.8% down from 63.0%. And the piece de resistance: Americans not in the labor force exploded higher by 535,000 to a new all time high 91.8 million.
If Everybody Dropped Out Of The Labor Force..... The Unemployment Rate Would Be Zero. From Economy Adds Only 74,000 Jobs In December; Jobless Rate At 6.7 Percent—There were only 74,000 jobs added to public and private payrolls in December, but the unemployment rate fell to a 5-year low 6.7 percent, the Bureau of Labor Statistics said Friday morning.It was a report that included several surprises for economists and raised questions about just how strong — or not — the labor market was as 2013 came to a close...To understand what's going on, it's important to dig into the data behind the unemployment rate. According to BLS, there were 347,000 fewer people in the "civilian labor force" last month than there were in November. That group includes both those who have jobs and those who say they're looking for work.Meanwhile, BLS says that 143,000 more people — a subset of the total labor force — reported they were working. When the total size of the labor force shrinks, but more people say they've got jobs, that brings the unemployment rate down.A key issue: Why were there fewer people in the labor force? According to BLS, 917,000 individuals were classified as "discouraged workers" last month. That was up by 155,000 from November. Discouraged workers are those who would like to have jobs, but have given up looking for work because they don't think they can find any
Some Thoughts on the December Employment Situation -- Somewhat of a surprise, nonfarm payroll employment increased only 74,000 in December, according to estimates from the BLS. Private NFP increased 84,000.The number was somewhat surprising given the high private NFP numbers released by ADP on Wednesday. On the other hand, anybody with an acquaintance with the BLS data knows that the series is subject to some considerable revision (not even taking into account benchmark revisions). Over the 2003-2013 period, the mean revision going from the first release to the third is 12,000, while the mean absolute revision is 46,000.Second, with the January employment situation release (in early February), the NFP series will be benchmarked-revised. Based on the preliminary benchmark revision, the series will be revised upward approximately 235,000.Taking these two obserations into account, one can see what the overall establishment picture looks like. In other words, one shouldn't take the exact number to heart; upcoming month-to-month revisions plus the shift in the level associated with the benchmark (due to more complete tax data) will likely mean a substantially altered number come next month.
It's Official: The US Created Less Jobs In 2013 Than 2012 -- The Fed spent over $1 trillion in 2013 (to push the stock market to all time highs) and all we got was... less jobs created than in 2012? Establishment survey 2012 vs 2013 job change: And Household survey 2012 vs 2013 job change:
Highlights From the December Jobs Report -- The Labor Department on Friday reported December jobs gains were much lower than expected as the year ended. U.S. payrolls rose 74,000 last month, the smallest rise in three years, while the unemployment rate dropped to 6.7%, Labor said Friday. Here are highlights:
- Revisions: Employment gains for November and October were revised upward by a total of 38,000. Employers added 241,000 jobs in November, up from an initially reported 203,000. October’s gain was unrevised at 200,000.
- Jobless Rate: The December unemployment rate decreased to 6.7%, from 7.0% the prior month, but that was because more people dropped out of the workforce rather than found new jobs.
- Yearly Figures: For 2013, employers added an average of 182,000 jobs each month. That is roughly in line with 2012, when payrolls expanded by about 183,000 positions each month.
- Participation Rate: The December civilian labor force participation rate was 62.8%, weaker from a month earlier. It is also down from 63.6% in December 2012.
- Longer-run Trend: December’s mild advance held back longer-term averages. Monthly job gains averaged 172,000 over the past three months, which was in line as well with the six-month trend. For the first half of 2013, payrolls expanded by 195,000 each month.
- Winners: In December, employment rose in the retail sector, which added 55,000 new jobs. Other strong gains came from the wholesale trade industry (15,000) and professional and business services (19,000).
- Losers: But employment in the construction sector was down by 16,000. Some economists had predicted before the report that colder weather could be to blame. The federal government’s workforce continued to shrink, with 7,000 fewer positions last month from November.
- Earnings and Work Week: The average work week for private employees edged down to 34.4 hours last month from the prior month. Meanwhile, average hourly earnings for private employees rose by 2 cents to $24.17 from a month earlier. Over the year, average hourly earnings have risen by 42 cents.
Comments on the Disappointing Employment Report - This was a disappointing employment report, but 1) it was just one month, 2) November was revised up, 3) other data suggests stronger hiring, and 4) there was some weather related impact (as expected). This report doesn't change my outlook. On weather, the BLS reported: Construction employment edged down in December (-16,000). However, in 2013, the industry added an average of 10,000 jobs per month. Employment in nonresidential specialty trade contractors declined by 13,000 in December, possibly reflecting unusually cold weather in parts of the country. There were probably other weather related impacts (unemployment claims spiked hire during the BLS reference week), but all the weakness can't be blamed on the weather (the report was still disappointing). Overall job growth was about as expected in 2013 (see table below), and I expect employment growth to pick up in 2014. Although construction was weak (weather related), seasonal retail hiring remained solid. See the first graph below - this is a good sign for the holiday season ("Watch what they do, not what they say") Typically retail companies start hiring for the holiday season in October, and really increase hiring in November. Here is a graph that shows the historical net retail jobs added for October, November and December by year.This graph really shows the collapse in retail hiring in 2008. Since then seasonal hiring has increased back close to normal levels. Retailers hired 176 thousand workers (NSA) net in December. This puts seasonal retail hiring at the highest level since 1999, and suggests holiday sales were decent. Note: this is NSA (Not Seasonally Adjusted): There is a decent correlation between seasonal retail hiring and holiday retail sales.Since the participation rate declined recently due to cyclical (recession) and demographic (aging population) reasons, an important graph is the employment-population ratio for the key working age group: 25 to 54 years old.In the earlier period the employment-population ratio for this group was trending up as women joined the labor force. The ratio has been mostly moving sideways since the early '90s, with ups and downs related to the business cycle.The 25 to 54 participation rate declined in December to 80.7% from 80.9%, and the 25 to 54 employment population ratio increased to 76.1% from 76.0%. As the economy recoveries, I'd expect both to increase back towards pre-recession levels.
Real Jobs Gap Not Closing Any Time Soon - December’s lackluster jobs reports offers another reminder of the huge hole in the U.S. labor market.U.S. payrolls rebounded slowly in what was known as the jobless recovery following the 2001 recession. As late as 2003 the economy was adding an average of only 5,000 jobs a month. The total number of jobs in the U.S. hit a peak of about 138 million in January 2008, one month after the start of the most recent recession. In the ensuing downturn, nearly nine million jobs disappeared through early 2010, when the labor market started turning around. Job gains accelerated in 2011 and have remained fairly steady since, edging up a bit each year. To date, almost 8 million jobs have returned, leaving a gap just shy of 1 million, which is likely to be closed this year. But that doesn’t account for changes in the population. If job growth had kept up with labor-force growth, the shortfall would be a lot bigger. If the population keeps growing at that same rate, and the U.S. continues to add jobs near 2013’s pace, then the total number of nonfarm jobs in the U.S. won’t get back to where they should be until 2019. If the pace picks up in 2014 and beyond — say to 250,000 a month — the gap will narrow sooner, in 2017. That said, the U.S. economy hasn’t added an average 250,000 jobs or more a month since 1999.
Eight Million Jobs Are Still Missing In America - Six years after the start of the Great Recession, nearly eight million jobs are still missing from the U.S. economy. That's how many more people would have jobs today if the economy were truly healthy, according to a new study released Thursday by the Economic Policy Institute, a left-leaning think tank. (Story continues after the chart of pain.) This estimate is based partly on how many jobs are needed to keep up with the potential growth rate of the labor force -- in other words, how many jobs would be needed to employ all the people who would be actively looking for work if the economy were running at full steam. That gap accounts for about 6.6 million of the missing jobs, in the EPI's estimate. The other 1.3 million missing jobs represent how far we still have to go before we get back to the level of peak employment just before the recession began.
Wolf Richter: “This Chart Is A True Representation Of The Employment Crisis In This Country” - Yves here. Wolf’s latest post gives a crisp overview of how bad things are in job land. Among other things, he highlights the catastrophically high unemployment levels among young people, and how financially stressed older workers are hanging on to jobs much more than they used to in the past.But there’s another layer to this picture. Heretofore, the pattern among employers in a downturn in managing the non-executive/senior managerial workforce was to push out higher-cost older workers in favor of cheap, high energy, less set-in-their-ways new hires. People in my age cohort and a bit older will attest that they know lots of people over 40 who were given the heave-ho. Some eventually found work at much lower pay, some became self-employed (it’s a lot harder than the business press lets on; 9 out of every 10 new businesses fail in the first three years), and some retired, living more modestly than they had wanted to. So why are more middle aged and old people hanging on? The fact that they can suggests strongly that employers are no longer paying a premium for experienced workers. It would make sense all day to hire young people if their wage rates really were lower. But most employers aren’t willing to invest in training. I’ve been reading on the tech site Slashdot for at least the last ten years of the dearth of entry-level jobs. To the extent that there is yeoman’s work that served as a way to train young professionals, like preparing legal briefs, that is increasingly sent overseas. And I’d hazard employers are either more willing to hire (or keep on) “overqualified” workers, or in a more competitive job market, those “overqualified” candidates have gotten smarter about dumbing down their resumes.
Which Fields Hold the Jobs of the Future? The Low-Paying Ones, Mostly - Elder care and other low-wage jobs will be among the fastest growing career fields over the next decade. Postal carriers and journalists might have a harder time finding work. Personal-care aide will be the fastest growing job from 2012 to 2022, among categories with more than 25,000 positions, the Labor Department said in a new report. The field will grow by nearly 50% to 1.8 million jobs. Personal-care aides help clients “with self-care and everyday tasks, and provide companionship,” the newly released Occupational Outlook Handbook said. The job requires no formal education, but most aides have a high school diploma. Workers in the field earned an average annual income of $19,910. “As the baby-boom population ages, there will be an increase in the number of clients requiring assistance,” the handbook said. The most job openings, due to both growth in the sector and employee turnover, will come for workers in retail sales and food and beverage service. Average income in those fields is less than $20,000 per year. Postal and media sectors are likely to shed jobs in the next decade. Employment among U.S. Postal Service workers is expected to decline 28%. Reporter and correspondent jobs will contract nearly 14%. Here’s a sortable table of the career fields that will grow and shrink in the next decade. All levels in thousands:
Forever Temp? - Betty McCray, 53, found work at a Nissan auto plant in Smyrna, Tenn., preparing parts for the assembly line. Not only is this job non-union, but McCray doesn’t technically work for Nissan—she’s employed through Yates Services, a temporary staffing agency. She’s one of a growing number of people who do the physically demanding work of manufacturing, but who, as temps, have none of the job security and few of the benefits that many Americans still associate with the sector. As an “associate” (the firm’s preferred term for temp), she works alongside permanent Nissan employees, but she is treated differently. She says she is paid less, gets no personal days and has to bring a doctor’s note if she is sick. Her job feels precarious, like she could be let go at any time. A 2010 report from the Bureau of Labor Statistics (BLS) found that “while manufacturing’s share of total national employment fell from 16.2 percent in 1990 to 9.8 percent in 2008, manu- facturing’s use of temporary workers greatly intensified.” Because the BLS categorizes temp workers as service employees regardless of the kind of work they do, the agency has no good data on how many of those “lost” manufacturing jobs simply migrated over to staffing agencies. But according to a 2004 report from the Council of Economic Advisers, a third of all temp service employees work in the manufacturing sector. “If the official manufacturing employment statistics are adjusted by this amount,” the authors found, “the decline in the level of manufacturing employment in the 1990s is eliminated.” In other words, a good number of jobs were simply outsourced right here at home, offloaded from company payrolls onto staffing agencies. For manufacturers, says Hatton, the logic is simple: “They have none of the costs of outsourcing with all of the benefits of outsourcing and all of the benefits of a native-English-speaking local workforce.”
Policies That Discourage Full-Time Work - Full-time positions pay more than part-time positions, even on an hourly basis. Part-time positions require less time away from family, schooling, etc., which makes the choice of full-time versus part-time work a trade-off between income received and the amount of the time commitment. A higher income tax or payroll tax rate tilts the balance toward part-time work because it reduces an important benefit of full-time work: extra income to spend. A lower rate does the opposite. Historically, employers have responded to high income tax rates by creating part-time positions, especially when large numbers of potential employers were facing those rates. For many years, the Social Security earnings limit reduced the reward to full-time work among elderly people, because a large part of their Social Security benefits were withheld when beneficiaries earned more than the limit. As a result of the income tax implicit in the Social Security rules, many businesses created part-time positions that were attractive to older workers because their earnings stayed below the limit, and many accepted them. Between 2007 and 2010, expansions of the food stamp program, known as SNAP, made part-time work increasingly attractive for those who would face the program’s income limit if working full time. About the same time, federal mortgage modification guidelines acted as income-tax increases on homeowners who owed more on their mortgage than their home was worth, because the more the homeowner earned, the less the mortgage balance was reduced. As a result, a few people found part-time work to be a more effective way of cutting their debt. I have quantified the disincentives for full-time work and their evolution, accounting for the fraction of the population taking part in these and other programs and showing the results in the chart below. A higher tax rate means less incentive to work full time and more incentive to work part time.
Still-High Unemployment Help Keep Wages Down -- A strengthening labor market has contributed to a small uptick in wages in recent months, but still-high unemployment will likely prevent big gains in the year ahead. At 7%, U.S. unemployment remains at levels previously only seen during recessions, and some economists question whether the nation’s recent rapid pace of job creation is sustainable. This large amount of slack reduces the pressure on employers to offer higher wages. Furthermore, many of the unemployed are younger workers in low-wage sectors of the economy that have accounted for an unusually large share of job creation during the recovery. The unemployment rate stands at 21% for workers age 16 to 19 and at 12% for 20- to 24-year-old workers.“The pool of labor available for lower-end jobs is still ample,” For the last couple of years, annual average wage growth has hovered around 2%, struggling to stay ahead of inflation and down from 3.5% before the recession struck in late 2007. These meager gains have undercut consumer spending, the largest component of the U.S. economy. Job creation in higher-wage sectors like construction and manufacturing has started to pick up in recent months, but employment gains have been largely driven by low-wage industries and it will take time to improve the mix, . “It’s going to be a slow recovery” for wages, Sectors like retail, food services and hotels accounted for 43% of new job creation since 2010, up from 30% in the years immediately preceding the recession, The slow recovery of the nation’s construction industry from the housing bust has been another factor behind the dearth of high-paying jobs,
Just a reminder: The US still has ludicrously high long-term unemployment – Since the Department of Labor began keeping track in 1948, the US has rarely had more than two million workers go without a job for more than six months. At the height of the recent Great Recession, nearly seven million people who wanted jobs faced extended joblessness, and today that number sits at a cool 4 million. (That’s also historically large as a share of population or the workforce). Despite many positive signs in the economy, that stands as perhaps its largest failure: The US just can’t put its people to work. As US lawmakers return from their winter vacation, president Barack Obama and the Democrats want to reverse the expiration of unemployment insurance for some 2 million of these people—1.3 million last week, and another 850,000 at the end of March. Typically, unemployment insurance only lasts 26 weeks, but during recessions the federal government offers extensions for as long as 99 weeks; the currently expiring extension is set at 73 weeks. Republicans support the expiration, or at least want an equal reduction in spending elsewhere in the government. The economic question is whether taking away an average $300 a week from these people will make them more or less likely to wind up with jobs. With roughly three unemployed workers competing for every job opening in the United States and the long-term unemployed among the most-discriminated against potential hires, it’s not clear that unemployment insurance is the main obstacle to their hiring.
Will Surge of Older Workers Take Jobs From Young? - Over at The Conscience of a Liberal, Paul Krugman moans about "Zombies and Cockroaches" -- ideas "that should have died long ago in the face of evidence or logic" and ideas "whose wrongness is so obvious, once pointed out, that the people who stated it claim that they did no such thing... Next thing you know, however, the roaches have invaded all over again." Dean Baker at Beat the Press marvels at the cognitive dissonance inherent in the notion that according to various news sources, "at the same time we have no jobs because the robots took them we must also struggle with the fact that we have no one to do the work because everyone is old and retired." I've got news for Krugman and Baker. It's not an ideas problem. It's an identity problem. Forget about zombies, cockroaches, robots and retirees for a moment. Much to the Sandwichman's dismay, an article appeared yesterday that rehearsed the fable that there is a lump-of-labor fallacy at the core of concerns about unemployment. I won't bother repeating the rebuttal beyond mentioning that the fallacy claim is a convoluted and dumbed-down version of Say's Law. Not only will an increase in labor supply automatically result in a proportionate increase in demand for labor, the "economists" maintain, but anyone who doubts such a auspicious outcome is guilty of believing that there is only "a fixed amount of work to be done." "Nonsense on stilts" doesn't begin to describe the arrogant stupidity of the claim. And, of course, it is impossible to refute such idiocy because it is so full of double-talk that no one can follow the claim itself, let alone the refutation.
Approaches to the Reduction of Aggregate Labor Time - Technology has reached the point where nobody should be compelled to spend most of their waking hours working in dangerous, menial or otherwise unpleasant jobs ('bad jobs', for short). It is increasingly possible to mechanize most menial and repetitive tasks. But of the bad jobs that continue for a time, there remains the question of how best to share the burden they impose. Even with better jobs, there is the potential to reduce standard working hours and create more free time for those who want it. Here, too, there is the question of how to manage such an overall reduction in working hours. Since some people will desire to maintain or increase their current working hours, ideally there should be latitude for them to do so, just as there should be latitude for others, so inclined, to shorten their labor-time commitment. In this post, three alternative approaches to the problem are briefly considered. They can be labeled 'universal job sharing', 'optional job sharing' and 'job or income guarantee'.
Slowdown in productivity growth still a puzzle - The slowdown seems to be a puzzle, with a variety of explanations, none of which seem to be entirely satisfactory. Here is what Ben Bernanke had to say about it yesterday: over the past year unemployment has declined notably more quickly than we or other forecasters expected, even as GDP growth was moderately lower than expected a year ago. This discrepancy reflects a number of factors, including declines in participation, but an important reason is the slow growth of productivity during this recovery; intuitively, when productivity gains are limited, firms need more workers even if demand is growing slowly. Disappointing productivity growth accordingly must be added to the list of reasons that economic growth has been slower than hoped. (Incidentally, the slow pace of productivity gains early in the recovery was not evident until well after the fact because of large data revisions--an illustration of the frustrations of real-time policymaking.) The reasons for weak productivity growth are not entirely clear: It may be a result of the severity of the financial crisis, for example, if tight credit conditions have inhibited innovation, productivity-improving investments, and the formation of new firms; or it may simply reflect slow growth in sales, which have led firms to use capital and labor less intensively, or even mismeasurement. Notably, productivity growth has also flagged in a number of foreign economies that were hard-hit by the financial crisis. Yet another possibility is weak productivity growth reflects longer-term trends largely unrelated to the recession. Obviously, the resolution of the productivity puzzle will be important in shaping our expectations for longer-term growth.Thoughts? Comments?
Boeing Saga Ends with 51% Favoring New Contract - As I argued last month, the Puget Sound area of Washington state was easily the best place, from a strictly economic point of view, for Boeing to build its new 777x jetliner. This was confirmed when, despite the rejection of its union contract offer by a 2:1 margin and opening an auction for a new facility, Boeing came back to the union with a second contract offer (h/t New York Times). Yesterday, by a 51-49 margin, workers voted to accept the contract. The new contract ends the company’s pension plan in favor of a 401(k), although it does not “affect the pensions already accrued.” This was unchanged from the previous offer. However, the company did make concessions on the time to raise to the top of a pay grade (6 years instead of the originally proposed 16) and by adding a second bonus payment, of $5,000, in 2020. The closeness of the vote shows how difficult a decision this was. Though the workers had a good bargaining position, it’s hard to negotiate with a gun to your head, and the company had also shown its willingness to do something stupid (from an economic point of view) when it put a production line for 787 in South Carolina rather than Washington. So, yet another company ends a true pension plan, contributing to the coming retirement crisis. Washington state gets to set another record for the largest incentive package in U.S. history, although it is surely a violation of World Trade Organization subsidy rules, as was Boeing’s 2003 package. And we see yet again the need to ban job piracy, which strengthens the kind of job blackmail we have seen in this case, like so many others
Boeing Result: Everyone Wins - In a rare vote in favor of common sense and local jobs, Boeing machinists Approve Contract securing 777X jet manufacture in Washington state. Boeing's machinists on Friday narrowly approved a crucial labor contract that secured thousands of jobs and billions of dollars of economic activity for Washington state but will cost workers their pensions. The vote of 51 percent to 49 percent to accept the deal means Boeing Co will build its new 777X jetliner and wings in the Seattle area, where Boeing has built aircraft for more than 90 years. Had the workers rejected the offer, Boeing would have considered making the successor to its popular 777 widebody jet elsewhere, and had received offers from 22 states interested in hosting the new factory. Boeing secured a no-strike agreement that lasts until 2024. As part of the plan, workers will shift from defined benefit plans to defined contribution (IRA-type) pension plans. Those are huge union concessions. But the all important counterbalancing force is people keep their jobs. 10,000 or so jobs stay in the region.
Boeing Goes to Pieces -- Japan is arguably already the world’s largest aerospace player. Certainly it is the ultimate source of a vastly larger share of the industry’s most sophisticated parts and materials than a reading of the English-language press would suggest. And given that Boeing now subsumes most of the erstwhile independent companies that put Neil Armstrong on the moon, its eclipse constitutes a major part of a larger story of American decline. In return for transfers of American technology and manufacturing know-how, the Japanese low-ball their prices for supplying an ever widening and more advanced array of components and materials. In many cases, Japan’s state-controlled airlines further sweeten the pot by paying top dollar for U.S. airframes and jet engines. All this boosts the American industry’s short-term profits. For the Japanese the seemingly steep upfront costs are a steal given the enormous amount of learning-by-doing that would otherwise be required to reinvent American production techniques. As for the American national interest, the most obvious consequence is an endless stream of layoffs of American blue-collar workers. Less obviously but equally debilitating, the U.S. aerospace industry’s dependence on Japanese and other foreign suppliers has greatly exacerbated U.S. trade imbalances. By extension, the U.S. Treasury has become ever more dependent on East Asia to fund the trade deficits. (Trade is the key to the real Japan—as opposed to the “basket case” presented in the media. Judged by the current account, the most meaningful measure of its trade, Japan’s surpluses have generally risen from the famously high levels they reached in the late 1980s.)
1,600 applicants for 3 dozen dairy plant jobs? Welcome to Hagerstown - Many applicants are desperate former employees still without work in a county with 7.3 percent unemployment and in an economy where manufacturing job openings now require more specialized abilities than the lower-skilled positions that have gone overseas or, in the case of Unilever, to Tennessee and Missouri, where labor and operating costs are cheaper. Wall Street is booming, the Federal Reserve is paring back its stimulus, there are bidding wars for houses again, but for blue-collar workers in places like Hagerstown the economic recovery has yet to materialize, and many around town worry that it won’t. Laid-off workers are living week-to-week on unemployment. They’re working temp jobs and trying to reeducate themselves. They are trying to save their houses from foreclosure. “You’d think that after 20-some-years working someplace at least somebody would think you are a good person, that you’d show up on time every day, and that would be worth something,” said Luther Brooks, a 50-year-old single father of four who lost his $40,000-a-year pasteurization job at the ice cream plant. “But I can’t get nothing. I’ve tried.”
Facing cuts, long-term unemployed brace for grim new year - Nancy Shields is among the millions of unemployed Americans who are losing their extended unemployment benefits starting this month. At one point, she managed a team of 60 people for a large retailer. She lost that job in 2011 but took another one—and a 20 percent pay cut—some months later. When that store closed in 2012, her luck ran out, and she has been looking for work ever since. "My federal [unemployment] benefits (were) about $1,200 a month, and that's all I get. … I have been very dependent on the generosity of my family members," Shields said. Her retirement savings exhausted, Shields said she doesn't know what she'll do if Congress doesn't eventually authorize an extension. Congress returns to work on Monday and Democratic and White House leaders vowed Friday to make restoring the benefits program a priority. The National Employment Law Project estimates that more than a million Americans are in the same situation. "For a lot of people and a lot of families, this is their only income source," said NELP federal advocacy coordinator Judy Conti. "This could pull the rug out from under 1.3 million families," she said. Without an extension, an additional 2 million will fall off the rolls in the first half of the year.
Congress’s Failure to Renew Federal Unemployment Insurance Means Share of Unemployed Receiving Jobless Aid Will Hit Record Low - As a result of Congress’s failure to renew federal jobless aid for the long-term unemployed in its budget agreement, the share of unemployed workers receiving jobless aid will drop to a record low of just one in four (26 percent) as of January 2014, according to an analysis released today by the National Employment Law Project. Not only is this the lowest share during this downturn, it is the lowest since the U.S. Department of Labor started recording this information in 1950.The loss of federal jobless aid will not only be a tough hit on unemployed workers and their families, but will also hit the economies of struggling states. Federal jobless payments have pumped billions of dollars into these states’ economies. The loss of federal jobless aid will deprive states’ economies of spending that supports 238,000 jobs, threatening recent job gains, according to NELP’s analysis. This will especially impact states with jobless rates currently above the national average of 7.0 percent, where three-quarters (76 percent) of federal benefits are estimated to be paid next year.
US economy losing 'up to a $1bn a week' after jobless benefits cut -- The US economy is losing up to a billion dollars a week because of the “fiscally irresponsible” decision to end long-term unemployment benefits, a Harvard economist said on Friday. Professor Lawrence Katz based his assessment on official forecasts of the impact to the economy of 1.3 million jobless Americans losing benefitsThe benefits, which apply to people who are unemployed for longer than six months, expired last week after a bipartisan budget deal on federal spending for the next two years failed to include a reauthorisation of the program.On Friday, Democrats in the House of Representatives released a state-by-state breakdown of Labor Department figures, showing the number of people who lost federal benefits when they expired on Saturday. The 1.3 million affected Americans are losing on average $305 per week. In total, Democrats said $400m had been “taken out of the pockets” of job seekers across the country.“That would mean there is almost a billion dollars we are losing from the economy because of not extending unemployment insurance benefits,” Katz said in a conference call organised by House Democrats. He later told the Guardian that the calculation was based on the “multiplier effect” of cancelling the benefits program, which had been forecast by the Congressional Budget Office (CBO). Applying the CBO’s estimated multiplier effect to the $400m per week being lost in benefits, Katz said, translated into a cost to the economy of between $600m and $1bn.
White House Wants ‘No Strings’ on Jobless Aid ---The White House, following several quiet weeks while President Barack Obama was vacationing in Hawaii, urged Congress on Monday to support an expanded unemployment-benefits program without offsetting the costs. “Today is the day that 1.3 million Americans start going to their mailbox and find that the check that they expected to get today is not there,” said Gene Sperling, the director of the White House National Economic Council, during the daily White House briefing. Benefits for the long-term unemployed expired at the end of the year and there appears to be little traction in the House. The Senate was expected to vote Monday on reviving the program but that vote could be delayed because frigid weather is making it difficult for senators to get back to Washington. House Speaker John Boehner (R., Ohio) has said the GOP might consider extending the benefits if they are paid for and if the administration includes other measures to boost growth. Mr. Sperling said the “president believes that we should pass this right away with no strings attached.” Legislation in the Senate would extend the emergency benefits for three months, at a cost of about $6 billion. It’s unclear whether there is enough support in the Senate for the measure to advance. Democrats generally support the measure, while most Republicans are opposed to it, citing the cost and arguing that it discourages people from finding work. However, one of the bill’s co-sponsors is Sen. Dean Heller (R., Nev.), whose home state has an unemployment rate of 9%.
The Moral Calculus Underlying Debate Over Unemployment Insurance -The Senate is working its way toward (possibly) overcoming a Republican filibuster of an extension of longterm unemployment insurance, after which the measure will die when John Boehner refuses to bring it up for a vote in the House. But there is a particular kind of moral clash at play in these negotiations, one that we don't think about very often. It has to do with the question of what makes liberals and conservatives distressed and angry. You can hear it in the way they talk about the issue. When liberals talk about extending unemployment insurance, they talk about people who can't find work and are keeping their heads above water only because of those benefits. Take away the benefits, and that family could lose their home or suffer other kinds of deprivation. What distresses liberals is the thought of a family that needs help not getting it. Conservatives don't deny that those people exist. But they don't talk about them. When conservatives talk about this issue, they focus on a different kind of person, the one who could get a job, but hasn't because he's chosen to suckle at government's teat, making taxpayers pay for his continued enjoyment of things like food and heat. Liberals don't deny that those people exist, either. What liberals believe is that even if you think that guy is "undeserving," taking away 50 other deserving people's benefits just so you can tell that one guy to get his butt down to Arby's to fill out an application would be unconscionably cruel.
Who's Your Economy? -- Have you seen the economic recovery? I haven’t either. But it is bound to be around here somewhere, because the National Bureau of Economic Research spotted it in June 2009, four and one-half years ago. It is a shy and reclusive recovery, like the “New Economy” and all those promised new economy jobs. I haven’t seen them either, but we know they are here, somewhere, because the economists said so. Congress must have seen all those jobs before they went home for Christmas, because our representatives let extended unemployment benefits expire for 1.3 million unemployed Americans, who have not yet met up with those new economy jobs, or even with an old economy job for that matter. By letting extended unemployment benefits expire, Congress figures that they saved 1.3 million Americans from becoming lifelong bums of the nanny state and living off the public purse. After all, who do those unemployed Americans think they are? A bank too big to fail? The military-security complex? Israel? What the unemployed need to do is to form a lobby organization and make campaign contributions. Just as economists don’t recognize facts that are inconsistent with corporate grants, career ambitions, and being on the speaking circuit, our representatives don’t recognize facts inconsistent with campaign contributions.
Vote in Senate Starts Talks on Extending Unemployment Benefits — The Senate’s unexpected vote on Tuesday to advance legislation extending expired unemployment benefits touched off delicate negotiations to secure final passage in the chamber, even as Republicans and Democrats warily eyed the political motives behind the efforts. The three-month extension of benefits passed with no room to spare, on a vote of 60 to 37, and some of the six Republicans who voted yes made clear that they wanted the $6.4 billion cost paid for through cuts elsewhere in the budget. Still, even getting the Senate on to the bill was a victory for President Obama and Democratic leaders, who have tried for weeks to steer away from health care and budget wrangling and onto pocketbook issues, which they say they will use to try to frame the 2014 elections. Republicans opposed to the extension will begin offering alternatives on Wednesday. Senator Marco Rubio of Florida, one of the Republicans’ potential presidential hopefuls, will speak about poverty and unveil proposals that he says will help the chronically poor without consigning them to a lifetime of government assistance. On Thursday, Representative Paul D. Ryan of Wisconsin, the Republican vice-presidential nominee in 2012, will also speak about a conservative approach to poverty.
Macro Implications of Extending Emergency Unemployment Compensation - From CBO: ...CBO estimates that extending the current EUC program and other related expiring provisions until the end of 2014 would increase inflation-adjusted GDP by 0.2 percent and increase full-time-equivalent employment by 0.2 million in the fourth quarter of 2014. ... ...Those figures represent CBO’s central estimates, which correspond to the assumption that key parameters of economic behavior (in particular, the extent to which higher federal spending boosts aggregate demand in the short term) equal the midpoints of the ranges that CBO uses. The full ranges that CBO uses for those parameters suggest that, in the fourth quarter of calendar year 2014, GDP could be increased very slightly or by as much as 0.3 percent, and employment could be increased very slightly or by as much as 0.3 million. The high end impact (which would seem more relevant given the ZLB and amount of slack in the economy [1]) is shown below.
In surprise move, unemployment benefits advance - The Senate begins an even tougher task after a surprise vote on Tuesday to break a GOP filibuster of legislation extending unemployment benefits. That is: finding a way to pay for the measure. Democrats were able to secure six Republican votes to advance the three-month extension of unemployment benefits, nabbing just the 60 votes that are necessary to move ahead. But now they must work with centrist Republicans to strike a bipartisan accord that would offset the legislation’s $6.5 billion cost, a tall task in a Senate still brimming with partisan divisions. But it’s not at all clear that the Republicans who sided with Democrats to break the filibuster will vote for final passage. Two of them said Tuesday they would most likely oppose it without the offsets they are seeking.
The GOP couldn't be more wrong about unemployment insurance - How do you improve the economy? If you ask some Republican members of Congress, the best way is to throw 1.3 million people into deeper poverty, starting this week. For some time, right-wing think tanks and conservative politicians have held on to a number of arguments that they believe prove it's a good idea to let unemployment benefits lapse for 1.3 million people. None of those arguments holds up under the least bit of scrutiny. America's economy would be far better off if Congress extended unemployment benefits. To look at their points, one by one, is to understand that the Republican opposition to extending unemployment benefits is dishonest. That argument may be true in a good economy, but it's false in a rocky one, where there aren't many jobs to go around. The scale of the US unemployment problem is far past the reach of bootstrapping. The US has over 10 million people unemployed, 4 million of them for more than 6 months (what we call the "long-term unemployed"). There are nearly another million people discouraged at being unable to find work, and 8 million others in low-wage, temporary jobs because they can't find full-time work. In short, it is the worst employment market since the recession of the late 1970s and early 1980s. In addition, families, thin on cash, aren't helping each other as much, leaving the unemployed without a private fallback from family and friends. The truth is, "bootstrapping" is not open to everyone. It is determined by class, education (which is often a function of class) and race. Pew Research found that those who "bootstrap" successfully already come from a place of privilege: they are mostly white, college-educated, and in dual-earner families. This is an economy where even a college degree is worth less than it used to be. There are twice as many college graduates working for minimum wage jobs now than 5 years ago. And roughly one out of every eight recent college graduates are unemployed (pdf), according to the Bureau of Labor Statistics.
What happens when jobless benefits are cut? North Carolina may offer clues - Last summer, North Carolina slashed the amount of cash it gave to people after they lost their jobs and the state also reduced the number of weeks they could receive benefits. Within several months, the unemployment rate fell a few ticks and by November it fell to a five-year low. Government data also shows that more than 22,000 North Carolinians found work since the cutoff and the number of unemployed sank by nearly 73,000 to 344,000. What the data doesn’t tell us, however, is what happened to all the people no longer classified as unemployed. While some found a job, others may have retired, ended up on welfare, moved in with family members, sought disability payments or fled to a nearby state with better benefits. We just don’t know.
In Jobless Youth, US Is Said to Pay High Price - Persistent high unemployment among young people is adding up to $25 billion a year in uncollected taxes and, to a much smaller degree, increased safety net expenditures, a new report says. “The key takeaway here is that it’s not just the individuals who are suffering as members of our generation,” “When you have an entire generation of people that are out of work, it’s going to create tremendous costs for taxpayers both now and in the future.” Fifteen percent of workers ages 16 to 24 are unemployed, compared with 7.3 percent of all workers. That does not include young people who are not working because they are in school, who are no longer looking for work or who were too discouraged to begin a job search. Much has been written about how much this will cost them in the long run, as they spend years trying to catch up. The new report is an effort to quantify the financial effect now. Its authors determined how much young people would have paid in taxes had they been working, and how much less they would have collected in unemployment and other social welfare spending. Each jobless worker between 18 and 24 accounted for $4,100 a year, they concluded, and those between 25 and 34 accounted for $9,875, the study said. Based on those figures, if youth unemployment were reduced to its prerecession rate, the study said, the federal government would recoup $7.8 billion, or $53 per taxpayer, and state and local governments would recoup $1.1 billion. If all those discouraged young people, who are not counted as unemployed because they are not actively seeking work, were also in the labor force, the total figure would be larger: $25 billion. About 93 percent of that number comes from taxes that would have been collected, and the rest from averting social spending, the study said.
Five Economic Reforms Millennials Should Be Fighting For -Millennials have been especially hard-hit by the downturn, which is probably why so many people in this generation (like myself) regard capitalism with a level of suspicion that would have been unthinkable a decade ago. But that egalitarian impulse isn't often accompanied by concrete proposals about how to get out of this catastrophe. Here are a few things we might want to start fighting for, pronto, if we want to grow old in a just, fair society, rather than the economic hellhole our parents have handed us.
- 1. Guaranteed Work for Everybody - Unemployment blows. The easiest and most direct solution is for the government to guarantee that everyone who wants to contribute productively to society is able to earn a decent living in the public sector. There are millions of people who want to work, and there's tons of work that needs doing – it's a no-brainer.
- 2. Social Security for All But let's think even bigger. Because as much as unemployment blows, so do jobs. What if people didn't have to work to survive? Enter the jaw-droppingly simple idea of a universal basic income, in which the government would just add a sum sufficient for subsistence to everyone's bank account every month. A proposal along these lines has been gaining traction in Switzerland, and it's starting to get a lot of attention here, too.
- 3. Take Back The Land. Ever noticed how much landlords blow? They don't really do anything to earn their money. They just claim ownership of buildings and charge people who actually work for a living the majority of our incomes for the privilege of staying in boxes that these owners often didn't build and rarely if ever improve.
- 4. Make Everything Owned by Everybody. Hoarders blow. Take, for instance, the infamous one percent, whose ownership of the capital stock of this country leads to such horrific inequality. "Capital stock" refers to two things here: the buildings and equipment that workers use to produce goods and services, and the stocks and bonds that represent ownership over the former. The top 10 percent's ownership of the means of production is represented by the fact that they control 80 percent of all financial assets.
- 5. A Public Bank in Every State. The whole point of a finance sector is supposed to be collecting the surplus that the whole economy has worked to produce, and channeling that surplus wealth toward its most socially valuable uses. It is difficult to overstate how completely awful our finance sector has been at accomplishing that basic goal. Let's try to change that by allowing state governments into the banking game.
#StandWithJesse: Plan For Radical Reform Causes Stir In Conservative Media - With America’s historic income gap being cited as the central issue in the upcoming elections, ideas to reform our economy are coming from all sections of the political spectrum. From conservatives who want to double down on trickle-down economics, to liberals who want a variety of marginal adjustments in hopes of kicking the old system back into gear. But there are also some radical ideas now on the table thanks to an unapologetic piece in Rolling Stone. The piece recommends five reforms that millennials should start fighting for now in hopes of seeing them achieved by the time they become the dominant political group.
1. Guaranteed Work for Everybody
2. Social Security for All
3. Take Back The Land
4. Make Everything Owned by Everybody
5. A Public Bank in Every State
The article, written by Jesse Myerson, almost immediately caused a conservative backlash on social media particularly twitter where the tag #StandWithJesse became a venue for twitter battles on Myerson’s proposal.
Push for Job Guarantee Gains Momentum -- I just returned from the big annual meeting of economists (this time in Philly), at which we had a panel on the Job Guarantee. One of the papers on our panel was by William (Sandy) Darity and Darrick Hamilton, which demonstrated how imperative it is to implement the JG to reduce hiring discrimination in the labor market. Darrick (who presented the paper) pointed out that official unemployment rates for black Americans is chronically twice as high as that for whites; by conventional views of what constitutes Great Depression levels of unemployment, black Americans are in a Great Depression and are always suffering from at least recession levels of unemployment. Darrick pointed out that even in good times, blacks with some college education have unemployment rates higher than white high school drop-outs, and even as high as whites who’ve been incarcerated. Sandy has supported the Job Guarantee since the earliest days—he was on the first panel we ever organized on the JG (back when we were calling it Public Service Employment). While the JG will not eliminate racial discrimination in the USA, it will go a long way in helping to provide a real opportunity.The highest unemployment rates are among the young. As Sandy says, black teen high school dropouts have a 95 percent joblessness rate. You read that right. The JG would give them an alternative path to gainful employment.
Lies, Damned Lies and Rhetoric - “The logic and evidence for full employment are strong, and someday, hopefully soon, logic and evidence will matter again” - Bernstein and Baker, Introduction to Getting Back to Full Employment, November 2013. What a depressing end to an introduction. A concession that the thesis that follows may not gain traction with politicians and the public despite the well-researched, detailed and cogent policy arguments, despite the charts or the nine and a half pages of references. I say ‘despite’, but perhaps ‘because of’. I imagine Bernstein and Baker’s concern is that it may not count for much in the face of a more compelling narrative, one based not on facts and detailed analysis but on something far less tangible. Politicians of all persuasions have long been accused of twisting the facts to suit their arguments, of presenting statistics out of context and of cherry-picking data to both make their case and rubbish that of the opposition. Indeed, ‘fact-checking’ has become a mini-industry, analyzing and publishing the levels of ‘spin’ on the numbers churned out in speeches, debates and articles. However, increasingly the concern expressed is not that data is being spun, it is that it is being ignored completely. Frustration is growing at the elevation and manipulation of emotional responses of the electorate – pitching people against each other rather than institutional power.
Economists agree: Raising the minimum wage reduces poverty - One funny part of watching journalists cover the minimum wage debate is that they often have to try and referee cutting-edge econometric debates. Some studies, notably those lead by UMass Amherst economist Arin Dube, argue that there are no adverse employment effects from small increases in the minimum wage. Other studies, notably those lead by University of California Irvine economist David Neumark, argue there is an adverse effect. Whatever can we conclude? But instead of diving into that controversy, let’s take a look at where these economists, and all the other researchers investigating the minimum wage, do agree: They all tend to think that raising the minimum wage would reduce poverty. That’s the conclusion of a major new paper by Dube, titled “Minimum Wages and the Distribution of Family Incomes.”
Greg Mankiw Battles the Minimum Wage - Dean Baker - Greg Mankiw uses his column today to take on the minimum wage. He criticizes President Obama for citing studies showing that the minimum wage has little or no effect on employment and points to studies finding that a higher minimum wage will lead to modest declines in employment. (See John Schmitt's excellent paper for a quick review of the state of the research.) Mankiw says that we should think of the minimum wage as a hidden tax that hits low wage employers. Mankiw argues that if we want to help out the working poor then the best way to do it is to have an explicit tax and use it to fund a higher Earned Income Tax Credit (EITC). He argues that the EITC is a fairer and more efficient way to help low wage workers. Let's give this one a bit of thought. First of all, Jared Bernstein has already made the obvious point that the EITC and minimum wage should be seen as complementary policies. If we raise the minimum wage then the EITC costs us less. Since the low tax Greg Mankiw and his allies are likely to reappear in public debates when the issue is not raising the minimum wage, we should be mindful of how much money the government spends on the EITC. We can also think about the incidence of the burdens from a higher minimum wage versus a higher EITC. In the latter case we would presumably be looking at an increase in the income tax as the source of revenue. Since we will probably not be getting too much more out of the one percent in the current political environment, the funding for the EITC would have to come from more middle class types. By contrast, the money to pay a higher minimum wage comes from several sources. As John Schmitt discusses in his paper, some of the higher wage will be passed on in higher prices. However some of this will come out of the record corporate profits that we have seen in recent years. And part of the higher cost will be made up in higher productivity as turnover drops and employers learn how to use workers more efficiently.
Greg Mankiw Offers a False Choice re Minimum Wage or EITC -- Once again a minimum wage opponent is trotting out what is now an old chestnut in this debate: we don’t need the minimum wage when we’ve got the Earned Income Tax Credit.That’s the theme of a piece by economist Greg Mankiw in today’s NYT, wherein he argues that low-wage workers, the firms that hire them, and we “as a nation” would be better off if we just got rid of the minimum wage and increased the EITC (actually, I’m unsure if he’s calling for an increase in the tax credit or just citing its existence; if he does want it increased, he needs to say so; better yet, offer a concrete proposal—DC policy-makers don’t do nuance on this stuff, Greg).For reasons I’ll stress below, it’s increasingly agreed upon that the choice Mankiw offers—EITC or minimum wage—is a false one. We need both. In fact, they’re complements. Pushing either too far invokes risks, though Mankiw ignores the risks of depending wholly on the EITC to lift the earnings of low-wage workers.
Blogs review: The minimum wage debate redux - What’s at stake: US President Barack Obama included a raise the minimum wage in last year’s budget in an effort to fight inequality and alleviate poverty, but was unsuccessful in securing its passage. Following his recent speech on inequality and upcoming mid-term elections, Democrats appear determined to redouble their efforts in 2014 to fight for this measure at the Federal level (where the current Democratic bill would raise to $10.10/ hour by 2016), as well as at the State level.
What the Inequality Debate Leaves Out - Brookings Institution - The debate about inequality just keeps heating up. At the end of the year, President Barack Obama called it "the defining challenge of our time." New York Mayor Bill de Blasio just promised a war for equality. Democrats across the country are thrilled at the prospect of raising the minimum wage. The 50th anniversary of President Lyndon Johnson's Great Society speech seems to have riled everybody up. And on Tuesday, Democrats won a small potential victory on behalf of the jobless, squeaking past a procedural hurdle so the Senate can proceed with debate on a bill that would extend emergency unemployment benefits for three months.But behind the headlines, the story is more complex. For one thing, we need to be clear what kind of inequality we care about. Do we want to close the gap between low and high earners, in which case a higher minimum wage would help? Or is it between the employed and unemployed, where a higher minimum wage is irrelevant or possibly slight harmful—but where unemployment benefits help a lot? Or is the income inequality we are worried about the one between the poor and the middle class, or the one between the affluent and the really, really affluent—that is, the top 1%. Most important of all, we need to be clearer about whether we are seeking greater equality of outcomes, or greater equality of opportunity.
The US declared war on poverty 50 years ago. You would never know it - This 8 January marks the 50th anniversary of President Lyndon Johnson's declaration of "unconditional war on poverty". The statement came in a state of the union address that, because of its often drab prose, has rarely drawn much praise. But a half century later, it's time to re-examine the case Johnson made in 1964 for remedying poverty in America. In an era such as our own, when – despite a poverty rate the Census Bureau puts at 16% – Congress is preparing to cut the food stamp program and has refused to extend unemployment insurance, Johnson's compassion stands out, along with his nuanced sense of who the poor are and what can be done to make their lives better. Johnson's 1964 ideas on how to wage a war on poverty (today a family of four living on $23,492 a year and an individual living on $11,720 a year are classified as poor) not only conflict with the current thinking of those on the right who would reduce government aid to the needy. They also conflict with the current thinking of those on the left who would make the social safety net, rather than fundamental economic change, the answer to poverty.
50 Years Later, War on Poverty Is a Mixed Bag - To many Americans, the war on poverty declared 50 years ago by President Lyndon B. Johnson has largely failed. The poverty rate has fallen only to 15 percent from 19 percent in two generations, and 46 million Americans live in households where the government considers their income scarcely adequate. But looked at a different way, the federal government has succeeded in preventing the poverty rate from climbing far higher. There is broad consensus that the social welfare programs created since the New Deal have hugely improved living conditions for low-income Americans. At the same time, in recent decades, most of the gains from the private economy have gone to those at the top of the income ladder. Half a century after Mr. Johnson’s now-famed State of the Union address, the debate over the government’s role in creating opportunity and ending deprivation has flared anew, with inequality as acute as it was in the Roaring Twenties and the ranks of the poor and near-poor at record highs. Programs like unemployment insurance and food stamps are keeping millions of families afloat. Republicans have sought to cut both programs, an illustration of the intense disagreement between the two political parties over the best solutions for bringing down the poverty rate as quickly as possible, or eliminating it.
Mapping Poverty In America (graphic) Data from the Census Bureau show where the poor live.
1-in-3 People Experienced Spell of Poverty From 2009 to 2011 - Americans often see poverty in stark terms — you’re either poor, and likely to remain so, or you’re not. But the latest government numbers show how much people slip in and out of poverty, and highlight a startling truth: A great many of us become poor at some point. Roughly one in three Americans (31.6%) was living in poverty for at least two months from 2009 to 2011, according to a new report by the U.S. Census Bureau that covers the tail-end of the recession, which began in December 2007 and ended in June 2009, and immediately after. In 2005 to 2007, only 27.1% of Americans experienced poverty for two or more straight months. Not only did more Americans slip into poverty in the recession’s aftermath — those who did had a tougher time. The typical length of a “poverty spell” was 6.6 months, up from 5.7 months in 2005-2007. And “chronic” poverty, or the share of Americans poor for the entire period studied, rose to 3.5% from 3% in 2005-2007. America’s official poverty rate, which Census said last September was unchanged in 2012 at 15% of the U.S. population — well above the 12.5% level in 2007 — comes from a government study called the Current Population Survey. This survey showed some 46.5 million Americans were below the official poverty line of $23,492 for a family of four. (A more comprehensive, supplemental measure put poverty at 16% in 2012.) But these measures offer only a snapshot of poverty in time, one based on the size of the respondent’s family at a given point — and don’t capture how much Americans are moving into and out of poverty, often within a single year.
White House Report: More Work to Do on Poverty - The White House late Tuesday released a 53-page report claiming that the country has made progress in reducing poverty but still has “more work to do,” particularly in expanding “economic opportunity.” The report was released in conjunction with the 50-year anniversary of President Lyndon B. Johnson’s “War On Poverty.” The White House said that the percent of the U.S. population living in poverty has fallen from 25.8% in 1967 to 16.0% in 2012, using a measure that takes into account tax credits and other benefits. But it said that there were still 49.7 million Americans living below the poverty line in 2012, including 13.4 million children. The White House report said that programs like Social Security and the Earned Income Tax Credit helped many Americans either deal with poverty or avoid it. It said that without tax credits and other benefits, 19.2% of Americans would be living in “deep poverty,” meaning they are below 50% of the poverty line. Instead, just 5.3% of Americans met that threshold, the White House said. The White House report found that poverty rates can vary widely based on someone’s educational background. For example, it said 35.8% of Americans aged 25 to 64 who failed to graduate from high school lived in poverty. That compared with just 5.9% of people with a college education in that age group lived in poverty. African Americans, Hispanics, and immigrants were more than twice as likely to live in poverty than whites, data showed.
Fifty Years Later the War on Poverty Is Lost - Fifty years ago Lyndon B. Johnson declared War on Poverty. Great strides were made. Between 1964 and 1965 Medicaid and Medicare were enacted, food stamps made permanent, a flurry of work and volunteer grants were passed, and educational opportunities were made more egalitarian. Unfortunately later administrations have been tearing apart Johnson's weapons against poverty one by one. Let's look at the track record. The reality is social safety nets have saved millions of Americans. Without social security, food stamps and Medicare, poverty would be 31% instead of the official 15% it is today. Medicare alone is estimated to have saved millions of lives. As it is, the minute people turn 65, there is a 20% reduction in deaths for the seriously ill. Before Medicare people 65 and over were being financially ruined with high medical bills. Only 56% had any health insurance at all. By the 1980's, after Medicare was enacted, the poverty rates for the elderly went from down dramatically Yet, Republicans have been after cutting Medicare and Medicaid ever since. FDR started the war on poverty and through his labor secretary Francis Perkins, enacted much of the social safety net which has saved America today. Social security alone reduced elder poverty from 44% to 9%. Now it is fifty years later, and income inequality is at 3rd world nation levels in America. The economic recovery in truth only happened for the top 1%. A whopping 43.9% of America will fall into complete financial ruin if they lose their jobs or have a medical crisis in less than three months. It is estimated that 80% of America will suffer poverty at some point during their lives.
Sen. Rubio Proposes Consolidating Poverty Programs – Sen. Marco Rubio (R., Fla.), considered a leading GOP presidential candidate in 2016, on Wednesday called for the federal government to consolidate all of its anti-poverty funding into one federal agency, which would then direct money to states so that its use can be tailored for local needs.The money would be called “Flex Funds,” Mr. Rubio plans to say in an afternoon speech, according to prepared remarks. He will say this money “would be transferred to the states so they can design and fund creative initiatives that address the factors behind inequality of opportunity.” Mr. Rubio didn’t specify which programs would be consolidated, but it could likely include food stamps, Medicaid, Supplemental Security Income, and Temporary Assistance For Needy Families. Combined, the government directs several hundred billion dollars each year to these initiatives. Although each of these programs is funded fully or partly by the federal government, they all include a certain level of state involvement.Mr. Rubio’s proposal would mark a sea change for Washington, effectively dismantling 50 years of federal programs and turning the money that funded them over to states.
Sen. Rubio Proposes to Kill the Countercyclicality of the Safety Net …and, if I’m understanding a sketchy proposal, to replace the EITC with a different wage subsidy that will increase working poverty among single-parent families with kids (I suspect it would increase poverty overall–i.e., a poverty measure that correctly includes the value of tax credits–but not sure).Anyway, Sen. Rubio gave a much touted speech this afternoon on poverty policy wherein he proposed to turn the federal safety net programs over to the states in the form of “revenue neutral” block grants. This is not a new idea folks. It’s rehashed Ryan, if not Reagan.“Revenue neutrality” may sound technical and inoffensive, if not fiscally sound, but what it really means is the safety net will be unable to expand in recessions. Let’s see the details, but typically under these arrangements, states will be unable to tap the Feds for unemployment benefits, nutritional assistance, and all the other functions that must expand to meet need when the market fails. This would be a huge step backwards, essentially enshrining poverty-inducing austerity in place of literally decades of policy advancements to meet demand contractions with temporary spending expansions. In the figure below, note the flat-line response by TANF in the great recession–it was block-granted in the 1990s–compared to SNAP or UI. That gives you the flavor of what happens when you follow where Sen. Rubio is trying to lead here.
Ryan Calls for Expansive Overhaul of U.S. Poverty Programs - House Budget Committee Chairman Paul Ryan (R., Wis.) on Thursday evening called for a complete overhaul of the U.S.’s approach to fighting poverty, saying the federal government needed to streamline certain programs and do more to boost employment and education. Mr. Ryan, in an interview at the Newseum moderated by NBC News’s Brian Williams, said the “War On Poverty” waged 50 years ago by President Lyndon Johnson “has failed. We should have done better than this. We can do better than this. Trillions of dollars of spending on this, and…46.5 million people living in poverty.” Mr. Ryan is one of several Republicans to call for an overhaul of anti-poverty programs this week, but his comments were the most sweeping. He stopped short of a proposal made Wednesday by Sen. Marco Rubio (R., Fla.), who called for the consolidation of all anti-poverty funding into a single program that disbursed money to the states. Instead, Mr. Ryan said the government should take a complete inventory of all anti-poverty programs, and buttress things that were working and scrap ones that weren’t. He said the government should back programs that offer income support, to encourage people to work, and he also called for housing vouchers and school vouchers that can help families move closer to their jobs and send their children to more successful schools. He said improving education must be a key plank to any initiative aimed at targeting poverty. “We have basically a haphazard smorgasbord of programs that were designed to solve different problems at different times,” said Mr. Ryan, who has said he is considering a run for president in 2016.
The War Over Poverty, by Paul Krugman - Fifty years have passed since Lyndon Johnson declared war on poverty. And a funny thing happened on the way to this anniversary. Suddenly, or so it seems, progressives have stopped apologizing for their efforts on behalf of the poor, and have started trumpeting them instead. For a long time, everyone knew — or, more accurately, “knew” — that the war on poverty had been an abject failure. And they knew why: It was the fault of the poor themselves. But what everyone knew wasn’t true, and the public seems to have caught on. The narrative went like this: Antipoverty programs hadn’t actually reduced poverty, because poverty in America was basically a social problem — a problem of broken families, crime and a culture of dependence that was only reinforced by government aid. Yet this view of poverty, which may have had some truth to it in the 1970s, bears no resemblance to anything that has happened since. It’s true that the standard measure of poverty hasn’t fallen much. But this measure doesn’t include the value of crucial public programs like food stamps and the earned-income tax credit. Once these programs are taken into account, the data show a significant decline in poverty, and a much larger decline in extreme poverty. Other evidence also points to a big improvement in the lives of America’s poor: lower-income Americans are much healthier and better-nourished than they were in the 1960s.
Frigid Weather Puts Homeless at Risk - Yves Smith - Although the current spell of nasty cold weather isn’t unusual by the standards of three decades ago, in the intervening years we’ve also had a big increase in homelessness, which means a lot more people are at risk of freezing to death. This Real News Network stresses that the rise in homelessness is the direct result of the reduction of funding of affordable housing since the Carter Administration. And stagnant wages plus the lousy job market since the financial crisis also means more people are living on the streets or in their cars. A third culprit that is operative in Manhattan and I assume other major cities is the near-complete disappearance of single-room-occupancy housing which has been converted to other uses. These weren’t just a mainstay for men in low-wage jobs or getting by on Social Security; it also provided a stopgap for people who had emergencies. As for homeless shelters, the intermittent press accounts indicate that most people avoid them; they are considered unsafe (the few goods you have on your person may be stolen) and the hours are very restricted (certain check in and lights out/wake up times). This post, with a report from a woman who had been in and out of shelters, gives a flavor of the conditions.
Lansing homeless shelters reach overflow status as record cold temperatures take hold – With record cold temperatures following this weekend's massive snowstorm, staying warm will be top priority for thousands in Lansing – especially those with no place to stay. "We don't want anybody at all to be outside in these temperatures," said Darin Estep, spokesman for Volunteers of America's Lansing chapter. "Last night, we hit our maximum. It was the highest amount [of people] we've had ever. Volunteers of America's shelter, 430 N. Larch St., is one of a number of Lansing homeless shelters that have experienced more traffic in recent months. In VOA's case, the shelter has been at or over capacity every night since mid-December. The shelter, which has a capacity of 66, averaged 77 people per night in December. The second half of the month, which included the Dec. 22 ice storm, saw the shelter averaged 83 people per night. The January numbers are more startling. Since New Year's Day, the shelter has averaged 93 people per night, including 101 last night during the snow storm. "The city has helped out. Today, they brought us some extra chairs for our day center; we had standing room only in our day room."
Record number of homeless people seek shelter at Pacific Garden Mission -- As temperatures dipped to where frostbite could find its way through gloves — with any exposed skin sliced by a withering wind chill — the homeless came in record numbers. The 155,000-square-foot Pacific Garden Mission, the city’s largest homeless shelter, has been around since 1877, but it was this week’s brutal cold that brought an all-time high of 1,050 homeless Chicagoans seeking refuge overnight. “We’re placing people anywhere we can, using classrooms, offices, auditorium, moving seats to make available floor space,” said the Rev. Phil Kwiatkowski, president of the mission. “That’s really saying something,” he said. “It’s better to be in a facility that’s a little crowded than outside where it’s a matter of life and death.” The record low temperatures hit 16 below zero at O’Hare on Monday morning, with wind chills at minus 42 at points.
Colorado’s Pot Shops Say They’ll Be Sold Out Any Day Now -- A few days into the experiment, the new world of legal recreational marijuana sales in Colorado appears to be a big success—so much so that pot shops are finding it impossible to keep up with demand. According to the Denver Post, at least 37 stores in Colorado were licensed to sell recreational pot to anyone 21 or over as of New Year’s Day. The Associated Press and others reported long lines outside Denver pot shops, with some eager customers forced to wait three to five hours before getting a chance to go inside, step up to the counter, and make a purchase. Prices have been steep—in some cases, stores were charging $50 or even $70 for one-eighth of an ounce of pot that cost medical marijuana users just $25 the day before—and taxes add on an extra 20% or so. Even so, sales have been brisk. The two operational pot shops in Pueblo collectively sold $87,000 of marijuana on January 1, per the Pueblo Chieftain, and store owners say that if demand persists anywhere near the current high, they’ll be sold out in the very near future. Likewise, Toni Fox, owner of the 3D Cannabis Center in Denver, told the Colorado Springs Gazette that a sellout is imminent. “We are going to run out,” she said on Thursday, day 2 of legal recreational marijuana sales. “It’s insane. This weekend will be just as crazy. If there is a mad rush, we’ll be out by Monday.” Another Associated Press story noted that some shops had to close early on Wednesday because they’d didn’t have enough marijuana on hand to oblige customers.
Talking Fiscal Impacts of Pot Legalization with MHP et al -- What with long lines forming outside newly legalized marijuana retailers in Colorado, I just did a segment on the Melissa Harris-Perry show on MSNBC [link to come] on the some of the economics and fiscal policy aspects of legalized pot. For those interested, here are a few points which came up in the discussion.
- –Economist Jeff Miron has written numerous clear analyses of the fiscal impact (here’s one). The savings, which he pegs nationally (meaning pot legalization as the law of the land) as amounting to between $10-20 billion annually, stem about equally from two sources: taxing sales and ending the enforcement of prohibition.
- –From that amount, however, policy makers must net out the costs of regulating the new industry, which are not likely to be trivial.
- –While legalization advocates have noted the fiscal benefits, ending enforcement has been a strong motivator as well. As Miron stresses, savings derive from less police activity in enforcing pot laws, and less costs to the judicial and incarceration systems (there were 750,000 arrests for pot in 2011).
- – MHPs panel focused on an interesting and important dynamic of the enforcement issue: it is not race or income neutral. While affluent people have of course been busted and prosecuted, the majority of penalties have fallen upon persons of color of limited means. This gives an element of social justice to legalization that is underappreciated (and well explored in this recent issue of the Nation).
“Absurd on every single level”: How the feds may be crippling the legal pot industry - Last week, Colorado became the first place in the world to legally sell regulated and taxed marijuana for adult recreational use. Despite the winter weather, long lines and heavy demand led some stores to jack up their prices or even sell out of product. The early success has elevated expectations for a new “green” economy, with a projected market value of $10.2 billion by 2018, according to Arcview Market Research. But one crucial detail threatens to hold the industry back. Because the federal government still classifies pot as a dangerous drug, corner cannabis stores and cultivators cannot secure access to traditional banking services, and do a shocking amount of their business in cash. Banks are reluctant to work with pot-related businesses, out of fear that the government will prosecute them for laundering illegally obtained money. This heightens the potential for crime at pot shops, imposes heavy costs on businesses seeking legitimacy, and could cripple the industry just as it gets started.
Where in the United States are the largest shadow economies? -- Recent studies of shadow economies focus primarily on cross-country comparisons. Few have examined regional or state-level variations in underground economic activity. This paper presents estimates of the shadow economy for 50 US states over the period 1997-2008. Results suggest that tax and social welfare burdens, labor market regulations, and intensity of regulation enforcement are important determinants of the underground economy. Among the states, Delaware, on average, maintains the smallest shadow economy at 7.28 % of GDP; Oregon, on average, has the second smallest shadow economy at 7.41 % of GDP; followed by Colorado, averaging 7.52 % of GDP, rounding out the three smallest shadow economies in the US West Virginia and Mississippi, on average, have the largest shadow economies in the US as a percent of GDP (9.32 and 9.54 %, respectively).
California Cities Lag in U.S. Jobs Recovery - Ten of the Golden State’s 26 metropolitan areas had double-digit unemployment rates in November, according to nonseasonally adjusted data released Tuesday by the Labor Department. All but six had jobless rates higher than the 6.6% national average. (The nation’s seasonally adjusted unemployment rate, the best known measure of U.S. joblessness, was 7%. That was a five-year low.) Of the nation’s 49 metropolitan areas with a population of 1 million or more, the 9.4% unemployment rate in California’s Riverside-San Bernardino-Ontario area was the highest in the nation in November. That was still down from 11.2% a year earlier. The area to the east of Los Angeles is home to the warehouses and online-shipment sites of many major companies and was slammed by the recession. San Bernardino filed for bankruptcy in 2012. Among cities of all sizes, California’s El Centro had the second highest unemployment rate in the nation, at 23.8%. Only Arizona’s Yuma, at 28.2%, was higher. Their continuing difficulties notwithstanding, California metros participated broadly in the nationwide trend of improving local job markets in November. Unemployment rates were lower in November than a year earlier in 293 of the nation’s 372 metropolitan areas, higher in 71 and unchanged in 8, the Labor Department said. Bismarck, N.D., had the nation’s lowest unemployment rate: 2.3%.
Maine’s GOP governor: I started working at 11 years old, so why can’t other kids at 12? - Maine’s conservative governor said the state was not using one of its greatest resources by keeping children out of the workforce until they were nearly old enough to join the military. “We don’t allow children to work until they’re 16, but two years later, when they’re 18, they can go to war and fight for us,” said Gov. Paul LePage. The Republican governor, who has said he started working at age 11, claimed the state economy was harmed by not allowing children to enter the workforce. Students who wish to work in Maine before age 16 must get a permit from their school superintendent, among other requirements. LePage plans to introduce legislation that would remove those restrictions and require children to get only a parent’s permission for summer jobs.
NJ government faces $214 billion debt; pensions are biggest cause (Watchdog) New Jersey’s state government is facing a $214 billion debt – more than $24,000 for every man, woman and child in the Garden State. But New Jersey is far from alone. For all 50 states, the figure exceeds $5 trillion — and that does not count the debts of federal government, counties or municipalities. Those numbers were crunched in a new study by State Budget Solutions, a nonprofit public policy group based in Virginia. “Fiscal changes are needed, and they are needed now,” SBS president Bob Williams said. “Breaking down the state debt totals reflects the alarming toll that reducing that debt may take on citizens, the local economy and state budgets if lawmakers do not take drastic action.” New Jersey ranks among the nation’s worst states for almost every debt category considered. The flood of red ink includes:
- •$64 billion in general debts, such as bonds and leases.
- •$108 billion of underfunded liability in retirement pension plans for state workers.
- •$41 billion for unfunded post-employment employee benefits, such as health coverage for retirees.
- The $214 billion estimate by SBS does not include the liability for local, county and public school workers in state pension plans.
Report: Deficits, bill backlog will increase if income tax expires -- A new report from Gov. Pat Quinn’s budget office shows the state facing massive cuts in spending and a huge increase in its bill backlog if the temporary state income tax is allowed to expire as scheduled next year. The three-year forecast, which the office is required by law to produce annually, shows spending outpacing revenue by $4.6 billion in three years. It also shows the state’s bill backlog growing to a projected $16.2 billion. “It shows the challenge ahead with the expiring revenue,” said Quinn’s budget spokesman Abdon Pallasch. “It shows the need to develop a solution that will allow the state to continue to pay down its bills and protect education and public safety services from radical budget cuts.” The report, though, does not recommend solutions to the expiration of the income tax increase. Quinn himself has refused to take a stand on whether to extend the tax. Lawmakers raised the income tax by 67 percent in 2011. The rate on individuals went from 3 percent to 5 percent. However, the rate is scheduled to drop to 3.75 percent on Jan. 1, 2015. That is midway through the state’s next budget year.
Puerto Rico Testing Investors Following Worst Loss - Puerto Rico, with $70 billion in government and agency debt and its economy contracting, faces the first test of investors’ willingness to buy its long-term securities with a plan to offer bonds following a thwarted 2013 offering. The U.S. commonwealth, with a credit rating on the brink of junk and a murder rate double Chicago’s, plans to issue an undetermined amount of long-term debt this month or in February, according to Alix Anfang, a spokeswoman for the Government Development Bank in New York. Soaring yields sandbagged a plan in the fourth quarter to sell as much as $1.2 billion of debt backed by sales taxes, called Cofina bonds after a Spanish acronym. While Governor Alejandro Garcia Padilla says the territory and its agencies will repay their obligations on time and in full, an economy that contracted in six of the past seven years casts doubt on that promise. Investors last week were demanding record yields to buy Puerto Rico debt.
Muni bond market searches for the bottom after worst year since 1994 - The venue for state and local entities to issue debt had its worst performance since 1994, and the market is still suffering from rising yields and withdrawals from mutual funds, with little indication of when the pain will end. The market ran into a perfect storm of negative events in 2013, as benchmark interest rates began to rise and financial catastrophe in Detroit and Puerto Rico spooked investors. That propelled the Barclays Municipal Bond Index to a 2.6% loss last year, its worst since 1994. Some of the more volatile sectors of the market declined further, with the S&P Municipal Bond Puerto Rico index dropping by 20.5% in 2013. The outlook for the coming year isn’t much better. Barclays projects market returns will stay in the red, in a range between negative 1.35% and negative 1.55%. Other sell-side researchers have similar expectations. The coming year is set against the fear that benchmark rates will continue to rise as the Federal Reserve winds down its bond-buying stimulus program. Rising Treasury yields have pushed municipal bond yields higher.
Jerry Brown $154.9 billion budget will propose repaying school funds, bolstering reserves - Gov. Jerry Brown will propose reducing the state's long-term debt by more than $11 billion next budget year and fully eliminating it by 2017-18, according to a copy of the budget document obtained by The Sacramento Bee. He also will propose repaying about $6 billion in deferred payments to schools and contributing $1.6 billion to a rainy day fund. Brown wants to restore some of the money cut from social service programs in recent years, and will propose a 5 percent increase in welfare grants. The budget projects $217.8 billion in unfunded retirement mandate and total state unfunded liabilities of $354 billion. The budget calls for spending $154.9 billion from all funds, including $106.8 billion from the General Fund. The plan's summary projects that spending on K-12 schools will grow to almost $70 billion, an increase of $22 billion from 2011-12. The summary makes no mention of transitional kindergarten, something championed by Democrats in both the Assembly and Senate in recent days.
Los Angeles library to offer high school diplomas - The Los Angeles Public Library announced Thursday that it is teaming up with a private online learning company to debut the program for high school dropouts, believed to be the first of its kind in the nation.It’s the latest step in the transformation of public libraries in the digital age as they move to establish themselves beyond just being a repository of books to a full educational institution, said the library’s director, John Szabo.Since taking over the helm in 2012, Szabo has pledged to reconnect the library system to the community and has introduced a number of new initiatives to that end, including offering 850 online courses for continuing education and running a program that helps immigrants complete the requirements for U.S. citizenship.The library hopes to grant high school diplomas to 150 adults in the first year at a cost to the library of $150,000, Szabo said. Many public libraries offer programs to prepare students and in some cases administer the General Educational Development test, which for decades was the brand name for the high school equivalency exam. But Szabo believes this is the first time a public library will be offering an accredited high school diploma to adult students, who will take courses online but will meet at the library for assistance and to interact with fellow adult learners.
The Decline in Education Jobs, Properly Measured - Taking a break from the confusing and unsettling jobs number today, I wanted to briefly highlight a post by my CBPP colleague Chris Mai on the loss of jobs in local education over the last few years. Whenever someone raises this issue, my first thought is “ok, but what’s happening with enrollments?” That is, it’s not an obviously bad thing for schools to adjust staffing levels to demand, i.e., enrollment. As shown in the figure, that’s not what’s happening here. Mai makes that point that these jobs cuts are occurring when enrollment has been growing. As an aside, looking at this figure reminded me a Sen. Rubio’s big, bad idea to turn all the safety programs over to the states. My strong sense is you’d see a lot more picture like the one above, where too many states would be unable or unwilling to ramp up services to meet needs.
The gap in medical education - Since its inception more than a century ago, modern medical education has undergone a series of quiet revolutions, stretching and scaling to accommodate advances in biomedical science. Yet this comprehensive expansion in one critical area masks a relative neglect of another. Despite their staggering scope — spanning genetics to geriatrics, and everything in between — medical curricula today largely omit training on health policy. The result? Even as today's medical students graduate with a deep scientific fluency, they leave all but illiterate when it comes to the healthcare system. I can bear witness to this disparity firsthand. The curriculum of Stanford Medical School, where I am a deferred first-year student, does not incorporate a single required course on health policy or the healthcare system across four years and 249 credits of training. And this oversight comes with consequences. To illustrate, recent research in JAMA Internal Medicine found that fewer than half of medical students nationwide understand even the basic components of the Affordable Care Act. On a systemic level, this illiteracy directly impedes our ability to institute meaningful health policy reforms that tackle such thorny issues as quality-based physician payments, comparative effectiveness guidelines or end-of-life care. Without willing and capable physician leaders to guide, implement and sustain such major shifts for the decades to come, reform efforts almost certainly will founder.
Jobs become more elusive for recent U.S. college grads -NY Fed (Reuters) - Recent college graduates in the United States face a more challenging job market, causing them to remain unemployed or take lower paying jobs than their counterparts in the past two decades, an analysis by the Federal Reserve Bank of New York has found. The report, released on Monday, analyzed more than 20 years of data and found that, while it generally takes new graduates some time to transition into the job market, today's graduates are having an even tougher time and many are accepting jobs for which they are overqualified, low-wage jobs or part-time work. "It is not clear whether these trends represent a structural change in the labor market, or if they are a consequence of the two recessions and jobless recoveries in the first decade of the 2000s," the report said. Even though overall U.S. unemployment has declined, falling to a five-year low of 7 percent in November, young graduates are entering an economy that is still fragile and far from its pre-recession levels. The report found that graduates from fields that provided technical skills or serve growing parts of the U.S. economy fared better. Healthcare and education graduates had lower unemployment rates of about 3 percent and 4 percent respectively, while construction and architecture majors and liberal arts and social sciences majors experienced the highest levels of unemployment of 7 percent to 8 percent.
More Students Subsidize Classmates’ Tuition - Well-off students at private schools have long subsidized poorer classmates. But as states grapple with the rising cost of higher education, middle-income students at public colleges in a dozen states now pay a growing share of their tuition to aid those lower on the economic ladder. The student subsidies, which are distributed based on need, don't show up on most tuition bills. But in eight years they have climbed 174% in real dollars at a dozen flagship state universities surveyed by The Wall Street Journal. During the 2012-13 academic year, students at these schools transferred $512,401,435 to less well-off classmates, up from $186,960,962, in inflation-adjusted figures, in the 2005-06 school year.At private schools without large endowments, more than half of the tuition may be set aside for financial-aid scholarships. At public schools, set-asides range between 5% and 40% according to the Journal's survey. The growth of subsidies is directly related to cutbacks in state aid, according to school administrators. Reductions in public spending for higher education have prompted universities to raise tuition levels, they said, making it tougher for students from poorer families to cover costs. To offset that burden, wealthy and middle-class students pay more in subsidies known as tuition set-asides.
For Too Many Americans, College Today Isn't Worth It - In the field of higher education, reality is outrunning parody. A recent feature on the satire website the Onion proclaimed, "30-Year-Old Has Earned $11 More Than He Would Have Without College Education." Allowing for tuition, interest on student loans, and four years of foregone income while in school, the fictional student "Patrick Moorhouse" wasn't much better off. His years of stress and study, the article japed, "have been more or less a financial wash." "Patrick" shouldn't feel too bad. Many college graduates would be happy to be $11 ahead instead of thousands, or hundreds of thousands, behind. The credit-driven higher education bubble of the past several decades has left legions of students deep in debt without improving their job prospects. To make college a good value again, today's parents and students need to be skeptical, frugal and demanding. There is no single solution to what ails higher education in the U.S., but changes are beginning to emerge, from outsourcing to online education, and they could transform the system.Though the GI Bill converted college from a privilege of the rich to a middle-class expectation, the higher education bubble really began in the 1970s, as colleges that had expanded to serve the baby boom saw the tide of students threatening to ebb. Congress came to the rescue with federally funded student aid, like Pell Grants and, in vastly greater dollar amounts, student loans. Predictably enough, this financial assistance led colleges and universities to raise tuition and fees to absorb the resources now available to their students. As University of Michigan economics and finance professor Mark Perry has calculated, tuition for all universities, public and private, increased from 1978 to 2011 at an annual rate of 7.45%. By comparison, health-care costs increased by only 5.8%, and housing, notwithstanding the bubble, increased at 4.3%. Family incomes, on the other hand, barely kept up with the consumer-price index, which grew at an annual rate of 3.8%.
Detroit Pensions Are Frozen, Then Thawed — The city’s emergency manager, Kevyn D. Orr, in an unpublicized move last week, ordered that pension benefits for thousands of public employees be frozen, but said on Monday that he would delay the move to allow for a possible compromise in federally mediated talks. Mr. Orr’s abrupt decision to stay his executive order of Dec. 30 came after protests from representatives of the general retirement system, which covers 5,600 active workers and 12,000 retirees. His executive order froze benefits for those employees and retirees, eliminated cost-of-living increases, and created a 401(k)-style retirement plan for all new city workers. The moves were intended to save Detroit money as it reorganizes its debts and liabilities in United States Bankruptcy Court. In backing off the order on Monday, Mr. Orr said that he reserved the right to reinstate the freeze retroactively to Jan. 1 if mediated talks could not produce a compromise on Detroit’s pension obligations. He did not say why he stayed the order, but his action came shortly after news reports disclosed it. “Time is running short, and the city’s financial status remains dire,” Mr. Orr said in a statement. “An additional delay without the prospect of a mediated solution threatens to further erode essential services and public safety.” Mr. Orr has estimated that the city has about $3.5 billion in unfunded pension liabilities that it cannot afford. Representatives of the pension funds have argued that the liabilities are considerably less.
Illinois is drowning in pension debt -- Illinois’ debt has grown so quickly in recent years that the state now has some of the highest debt levels in the nation. Illinois’ pension and other bonded debt exceeded $127 billion at the end of fiscal year 2013. Pensions are the single-largest driver of that debt burden. Illinois closed the last fiscal year with $97.5 billion in unfunded pension liabilities. And pension bonds made up more than $14 billion of the state’s nearly $27 billion in general obligation bonded debt. To put those numbers into perspective, Illinois had just $7.6 billion in general obligation bonds at the close of fiscal year 2002 and its unfunded pension liability hovered around $35 billion. But rapid growth in unfunded liabilities and three very large rounds of pension borrowing caused those numbers to skyrocket.According a recent report by the Illinois comptroller:“Since June 2003, Illinois has issued three series of pension bonds. The largest, which was worth $10 billion in June 2003, was followed by issues of $3.5 billion in January 2010 and $3.7 billion in March 2011. Each issue produced enough revenue to allow the state to make its employer’s contribution for the respective year instead of using General Funds revenues … “Pension bond debt service is a significant burden on the current budget. Debt service on the three previously mentioned pension bond issues will exceed $1.6 billion in fiscal year 2014.”
Getting the Facts Right on Social Security…CRFB responds - Dan here…this posts is a direct response to Dale Coberly’s post. Both posts are long and complicated, so I and Marc expect further posts to tackle particular policy issues. cross posted with Committee on Responsible Federal Budget. In response to our piece, “Setting the Record Straight on Social Security,” Dale Coberly calls both our facts and our opinions “lies.” In his treatise, Coberly adds several important ideas to the discussion, but much of his piece misrepresents CRFB’s views, misattributes our motives, and asserts claims which are simply not based in fact. We pride ourselves on our fact-based, non-partisan analysis, which Coberly calls into question in his piece. Below, we review and debunk many of his claims: Coberly claims that “CRFB would like you to believe the only solution is to cut benefits,” that we only “pretend to be open to revenue enhancements,” and that our Social Security Reformer “is rigged so you can’t give the correct answer [of gradually raising the payroll tax rate].”This claim is nonsense. The blog clearly states that a reform “could increase revenue coming into the system, slow the growth of benefits being paid out, and even offer some targeted benefit enhancements to those who truly need them” – and we have said this consistently over the years. In fact, our do-it-your-self Reformer offers users a number of different revenue options to choose from and lets users increase the payroll tax rate by whatever amount they wish (it’s true we don’t have the functionality to adjust the phase-in rate of tax or benefit changes, which we hope to include in a future version). In addition, the two plans we repeatedly cite in our blog – Simpson-Bowles and Domenici-Rivlin – both propose a mix of revenue and benefit changes, and a separate plan developed by CRFB President Maya MacGuineas along with Jeff Liebman and Andrew Samwick relied heavily on revenues as part of a solution, which also included targeted benefit enhancements.
CRFB comments on the one tenth percent/year increase - A response to Dale Coberly’s tax increase proposal summarized here: i have been saying for some years now that a one tenth of one percent per year increase in the payroll tax for EACH the employer and the employee would entirely pay for the “actuarial deficit” and would fund Social Security out into the infinite horizon. by CRFB: Coberly’s short response to today’s post makes one assertion we disagree with and one we mostly agree with.Coberly asserts we rely on other parts of the “Peterson machine” to support our facts. In fact, almost all the sources we cite are official government sources, including the Congressional Budget Office, the Government Accountability Office, the President’s own Office of a Management and Budget, the Social Security Administration, and the Social Security Trustees — whose job it is to provide Congress and the public with information on the financial condition of the Social Security trust fund.With regards to Coberly’s proposed tax increase, we more or less agree. Since Coberly cited combined payroll tax numbers in the rest of his blogs, we assumed his proposal to raise the payroll tax rate by 0.1 percent per year was on a combined basis. If instead we raised the payroll tax rate by 0.1 percent each for employers and employees — 0.2. total — it would raise a lot more than we assumed in our post. By our math, raising the payroll tax 0.2 percent per year over 20 years (a total of 4 percent, 2 on the employer and 2 on the employee) would more than achieve solvency over the next 75 years and close 80% of the program’s gap in the 75th year.
The Three Card Monte of Generational Warfare - Yves Smith - Stock speculator Jay Gould remarked, “I can hire one half of the working class to kill the other half.” That, sports fans, is the real foundation of the generational warfare propaganda effort. It’s being openly pushed on college campuses by billionaire and long term heavyweight Republican donor Stan Druckemiller, and is apparently being worked hard through media channels. I was surprised to see a website that has often featured cogent, articulate political analysis serve up a boomer-blaming piece that was all broad stereotypes, and a couple of tidbits presented as evidence when they were at most decoration (I’m not about to dignify it by linking to it). If anyone had tried running a similarly hate-mongering piece about blacks or gays, they would have been called out. At least this post got some pushback in comments. We have two events happening that may simply be coincident in time in their genesis, but they are working synchronistically in a nasty way. And the driver of one is unquestionably class, not generational. I can’t get over the way young people are falling hook, line and sinker for the efforts to divert attention from the real perps, which are overwhelmingly the top wealthy and their allies and operatives, such as CEOs and C-level executives at large companies, and the large cohort of neoliberal pundits. The first is that a small group of audacious, visionary, committed, radical conservatives set in motion a plan in 1971 to undo the New Deal and cut social safety nets back. They did this via a concerted effort to change values and deeply inculcate pro-business thinking, to give economic “freedom” primacy over democracy, and to train lawyers to think like economists (which is at odds with foundational legal concepts like equity) and over time, pack the courts with corporate-friendly judges.
Millennial Perspective: How to Strengthen Social Security - Millennials – or Generation Y – who stand to benefit (or suffer) the most from today’s decisions and who make up an increasing share of the voting population, should be advocating on behalf of Social Security. Millennials should take a strong stance as ‘entitlement reform’ continues to be a hot-button item in ongoing budget discussions. Social Security is currently able to pay all scheduled benefits in full through 2033 and 75 percent of benefits beyond that. In order to continue to pay out benefits in full beyond 2033, it will need some adjustments. The projected shortfall is due to a confluence of factors including the retirement of the baby boomers. Millennials support specific policy options that increase benefits, and their support will be critical in the coming months both to defend Social Security, and to move from a narrative of “preserving” to one of “strengthening.” The current fiscal and budget narratives often discuss reforms in a framework of cutting benefits, which hurts recipients, in an effort to preserve the program. They largely fail to consider policy changes that will improve the program’s long-term financial outlook. We, as Millennials, should be clamoring for a real conversation around entitlements. Millennials don’t mind paying more to ensure the program stays strong for our eventual retirement. And, given the economic climate and the stunted earning potential of so many young people, changes that strengthen the program early will only serve us better in the years to come.
Subdued Medical Inflation Contains Spending Even as More Seek Care - A slower increase in health prices helped contain total medical spending in 2012 even though Americans visited doctors and hospitals more. Health-care spending increased in 2012 at nearly the same pace as the modest gains recorded since the economic recovery began in 2009. A difference in 2012, compared with 2011, was that less of the gain was attributable to more expensive care and more of it was due to increased usage, according to a report released Monday by the Centers for Medicare and Medicaid Services. The aging population made more visits and sought more intense treatment from hospitals, doctors and other providers, the report said. In addition, the improving economy and lower unemployment encouraged some patients to pursue elective procedures they had put off in previous years. Those factors would have caused health expenditures to rise more rapidly in 2012 had medical prices increased faster than overall inflation, as was typical in the decade prior to the current recovery. Instead, health-care inflation slowed to a 1.7% increase in 2012 from a 2.4% rise the year prior. Overall inflation, as measure by the consumer price index, advanced 2.1% in 2012.
U.S. health spending rose 3.7 percent in 2012 as economy dragged - (Reuters) - U.S. healthcare spending rose 3.7 percent in 2012 to $2.8 trillion, the fourth year in a row in this range as the slow economic recovery tempered private insurance use, drug prices fell and the government held back payment increases for doctors, the Obama administration said on Monday. Since 2009, increases in spending on healthcare have run from 3.6 percent to 3.8 percent, below pre-recession rates which have been falling since their peak in 2003, the report from the U.S. Centers for Medicare and Medicaid Services said. "The relative stability since 2009 primarily reflects the lagged impact of the recent severe economic recession," Anne Martin, an economist in the Office of the Actuary at CMS said during a news briefing. On average, the cost for medical care was $8,915 per person in 2012, up from $8,658 per person in 2011. The report comes as more than 2 million Americans on January 1 began receiving new coverage under President Barack Obama's healthcare reform law, commonly known as Obamacare. The law, passed in 2010 and formally called the Affordable Care Act (ACA), aims to extend insurance to millions of previously uninsured or underinsured Americans through online exchanges that offer government subsidies based on income. It also expands the Medicaid program for the poor in nearly half of the states. The report did not estimate how the ACA might affect 2014 spending, and the data for 2012 is the most recent official government information detailing expenditures for healthcare. Reining in that spending is seen as an important step toward tackling the U.S. budget deficit.
ObamaCare Is Slowing Health Inflation - Jason Furman - For decades a common refrain was that the rapid rise in health spending hurt the competitiveness of American businesses and ate into workers' take-home pay. Businesses and politicians from both sides of the aisle agreed that something had to be done to slow the growth of health-care costs. New data Monday from the Centers for Medicare and Medicaid Services show that we are making important progress. From 2010 to 2012, health spending grew at an annual rate of just 1.1% in real per capita terms—the lowest rate in the 50 years we have been collecting these data, and a small fraction of the 6% rate that inaugurated the past decade. This historic but largely unheralded slowdown in health spending, which is thanks in part to the Affordable Care Act (ACA), is helping to boost employment, lower deficits and bolster wage growth as the job market strengthens. Notably, the rise in Medicare costs has slowed, with real Medicare spending per beneficiary essentially unchanged from 2010 to 2012. Historically, trends in Medicare spending have little to do with the strength of the overall economy. In the past few years, the slowdown has in significant part been reflected in the price of health care, rather than the quantity of health care that patients receive. Since the ACA was signed into law in March 2010, prices for health-care goods and services have risen at a 1.8% annual rate, the slowest rate for a comparable period in nearly 50 years, and just 0.2% above general price inflation, a gap that has only been as narrow on one other occasion since the 1970s. Many factors, including the recession and one-time developments like blockbuster drugs coming off patent, have contributed to the slowdown, which started in the middle of the last decade. But the slowdown has deepened since the ACA passed, and evidence shows the law has made a meaningful contribution.
The Slowdown in Rising U.S. Healthcare Costs - Back in the early 1960s, spending on health care in the United States was under 6% of GDP. In the data released for 2012, U.S. health care costs are 17.2% of GDP. As the share of the economy being spent on health care has tripled, arithmetic teaches that the share being spent on everything else must diminish. When I was first studying health economics back in the late 1970s, it was common to hear that rising health care costs were already out of control. But we have now reached the point where many people have been facing the trade-off of more costly health insurance from their employer at the cost of lower take-home pay. The long run budget problems of governments at all levels are largely driven by the prospect of continually rising health care costs. Thus, the possibility of a slowdown in health care costs is big news, and that is what is reported by the National Health Expenditure Accounts Team in an article in the first issue of Health Affairs for 2014 (pp. 67-77). Here's a graph in which the blue line shows national health expenditures (NHE) as a share of GDP since 1990, while the red line shows the annual percentage growth rate of health care spending.The red line makes two obvious points. First, the slowdown in rising health care costs started back around 2002 or 2003. Indeed, health care economists have been writing about it for a couple of years now, and OECD evidence point out that a similar slowdown seems to be occurring across high-income countries. Thus, eager claims by Obama administration officials about how the Affordable Care Act--although still far from fully implemented--is bringing down the rise in health care costs are a prime example of finding a parade, running to the front, and then claiming to lead the parade.
Obamacare Medicaid Split Creates Two Americas for Poor - Amber Sanchez, a San Francisco cancer survivor, skipped visiting the gynecologist last year to check a growth on her ovary because she was uninsured. This year, it’s at the top of her New Year’s plans. The difference: As of Jan. 1, the 27-year-old is eligible for California’s Medicaid expansion under Obamacare. In Alabama, which rejected the expansion, Jefferica Poindexter isn’t so lucky. Dealing with high cholesterol, chronic sinus pain and a bad back, she depends on emergency rooms and nonprofit clinics -- when they can see her. “They’re already booked by the time they get to me.” The women’s fates are the consequence of a political debate that’s divided the U.S. roughly along party lines: Democratic-led states have expanded Medicaid programs for the poor under the health law; most Republicans have refused. While the law’s online exchanges draw more scrutiny, it’s Medicaid that may determine the health of millions of Americans. The expansion is one of the twin pillars created by the law to supply medical care to the nation’s uninsured, complementing subsidies for private insurance. Still, with only 25 states choosing to participate in the expansion, almost 5 million people will be left out, according to the Kaiser Family Foundation, which studies health policy. “These are real people with real health-care needs who may work but don’t have a lot of income, and no way to be able to afford health insurance,”
The Medicaid Cure - Paul Krugman - Something really interesting is happening on the health-care front: costs are rising much less rapidly than anyone expected. One thing I haven’t seen mentioned much, however, is that another aspect of recent developments — the rapid rise in Medicaid enrollment, despite Republican efforts to block it — adds to the prospect of continuing good news on health costs. Medicaid gets a bad rap. It’s a poor people’s program, and it’s widely assumed that this means poor care. In fact, there’s not much evidence that this is true, and claims that Medicaid patients can’t find care are greatly exaggerated. Beyond that, however, Medicaid is the piece of the US health care system (aside from the VA) that does the best job of controlling costs. It does this by being able to say no. This ability to say no, combined with its size, means that Medicaid covers people far more cheaply than private insurance, and probably than Medicare.One way to think about this is that Medicaid is actually the piece of the US system that looks most like European health systems, which cost far less than ours while delivering comparable results. Now, expanded Medicaid is a key part of Obamacare — and so far, despite GOP obstruction, Medicaid enrollments have outpaced insurance through the exchanges. This is often reported as if it were a bad thing — as if Medicaid were somehow a fake solution, as if only purchases of private insurance count. But Medicaid is good, very cost-effective coverage! And rising Medicaid enrollment is, aside from a huge benefit to the previously uninsured, a step toward better cost control in the system as a whole.
HealthCare.gov defects leave many Americans eligible for Medicaid, CHIP without coverage - More than 100,000 Americans who applied for insurance through HealthCare.gov and were told they are eligible for Medicaid or the Children’s Health Insurance Program (CHIP) remain unenrolled because of lingering software defects in the federal online marketplace, according to federal and state health officials. To try to provide coverage to these people before they seek medical care, the Obama administration has launched a barrage of phone calls in recent days in 21 states, advising those who applied that the quickest route into the programs is to start over at their state’s Medicaid agency. State officials, meanwhile, are racing to cope in various ways — some enrolling people based on imperfect data files they received from Washington, others mailing letters urging eligible people to contact the state to sign up. The chaos is likely to prove temporary because of the state and federal efforts that have just begun to help people enroll and because the coverage can be made retroactive to the first of the year.
Americans paying bigger share of medical bills - Health care spending continues to increase each year, but the pace of growth has slowed considerably over the past four years, the Centers for Medicare and Medicaid Services said Monday. Americans might cheer such news, were it not for the fact that they’re footing a bigger share of the bill. Even those who have insurance have had to pay more out-of-pocket expenses for care, according to the report published in Health Affairs. And insurance experts and researchers also say it’s unclear whether the Affordable Care Act will alleviate those costs in the long run. The analysis found that on average, some consumers paid a bigger share of their medical costs in 2012 than they did the year before. Out-of-pocket medical spending, or the amount consumers must spend on expenses such as deductibles, co-payments for prescription drugs and doctors’ visits, grew by 3.8% in 2012, more than the 3.5% increase seen in 2011. That’s partly because more Americans are signing up for high deductible plans, Anne B. Martin, an economist in the office of the actuary at CMS and the lead author of the Health Affairs article, said during a conference call Monday. The figures support other studies showing a long-term trend of employers passing along more health-care costs to employees, making them pay a bigger share of their premiums and moving workers onto high deductible plans. Workers faced an average annual deductible of $1,135 in 2013, up from $735 in 2008, according to the 2013 Employer Health Benefits Survey by the Kaiser Family Foundation. The average copayment required for a physician office visit increased to $23 from $19 over that same time period.
Early days of Obamacare bring trickle, not flood, of patients (Reuters) - U.S. medical providers are seeing only a trickle of patients newly insured under President Barack Obama's healthcare law, as insurers, hospitals and doctors try to work out any hitches in coverage. More than 2 million people have signed up for new private health plans that took effect on Wednesday under the Affordable Care Act, popularly known as Obamacare. While some of those consumers were already lining up doctor visits last month, early reports from providers and an online medical booking service show the demand for care has been modest so far. Within the Obama administration, officials fear a surge of patients in the coming weeks could spotlight cases where consumers who signed up for insurance can't immediately get care due to technical failures on the government's HealthCare.gov enrollment website. Contrary to fears that Obamacare enrollees would be sicker than other Americans, with serious and expensive pent-up medical needs, so far they are not much different from other Americans, according to data from ZocDoc, a six-year-old closely held company that allows patients to find a doctor who accepts their insurance and make an appointment online.
Has Obamacare really signed up 10 million people? - Here's how that number breaks down: 2.1 million people have signed up for private insurance through the exchanges. About 4.4 million people have signed up for Medicaid coverage. And about 3.1 million young adults got coverage through Obamacare's rule forcing insurers to cover dependents up to age 26. Then there's the unknown number of people who bought Obamacare-based coverage directly from insurers. The question is how many of these people really got coverage through Obamacare? The exchange numbers are solid. You can trust those. The 3.1 million young adults who got coverage through the new insurance regulations is a pretty reliable figure, too -- though it's measuring something different than what people are usually thinking of when they ask how many people Obamacare has signed up. But the Medicaid numbers are more complex. Each state runs its own count, and the data includes people who enrolled in Obamacare's Medicaid expansion as well as people who were eligible under prior law. To the Obama administration's annoyance, some states are also counting people who're simply renewing existing Medicaid policies. A lot of the 4.4 million people who got coverage under Medicaid in the last few months got it from Obamacare's Medicaid expansion. Even more would've gotten it if all the states were participating in Obamacare's Medicaid expansion. But some simply got coverage under the preexisting Medicaid program. (And then there are the 100,000+ people who thought they got Medicaid through Obamacare but, due to a bug, were never actually enrolled.)
Obamacare: Adding a baby to health plan not easy - — There's another quirk in the Obama administration's new health insurance system: It lacks a way for consumers to quickly and easily update their coverage for the birth of a baby and other common life changes. With regular private insurance, parents just notify the health plan. Insurers will still cover new babies, the administration says, but parents will also have to contact the government at some point later on. Right now the HealthCare.gov website can't handle such updates. It's a reminder that the new coverage for many uninsured Americans comes with a third party in the mix: the feds. And the system's wiring for some vital federal functions isn't yet fully connected. It's not just having a new baby that could create bureaucratic hassles, but other life changes affecting a consumer's taxpayer-subsidized premiums. The list includes marriage and divorce, a death in the family, a new job or a change in income, even moving to a different community. Such changes affect financial assistance available under the law, so the government has to be brought into the loop.
Enrollees at Health Exchanges Face Struggle to Prove Coverage - Paul D. Donahue and his wife, Angela, are among more than a million Americans who have signed up for health coverage through the federal insurance exchange. Mr. Donahue has a card in his wallet from his insurer to prove it. But when he tried to use it to get a flu shot and fill prescriptions this week, local pharmacies could not confirm his coverage, so he left without his medications. Similar problems are occurring daily in doctors’ offices and drugstores around the country as consumers try to use insurance coverage that took effect on Jan. 1 under the Affordable Care Act. In addition to the difficulties many face in proving they have coverage, patients are also having a hard time figuring out whether particular doctors are affiliated with their health insurance plan. Doctors themselves often do not know if they are in the network of providers for plans sold on the exchange. But interviews with doctors, hospital executives, pharmacists and newly insured people around the country suggest that the biggest challenge so far has been verifying coverage. A surge of enrollments in late December, just before the deadline for coverage to take effect, created backlogs at many state and federal exchanges and insurance companies in processing applications. As a result, many of those who enrolled have yet to receive an insurance card, policy number or bill. Many are also having trouble reaching exchanges and insurance companies to confirm their enrollment or pay their first month’s premium. Doctors’ offices and pharmacies, too, are spending hours on the phone trying to verify patients’ coverage, sometimes to no avail.
An Error Message for the Poor — MORE than two million people have signed up for health insurance coverage under the Affordable Care Act, a tribute to the effectiveness of the “tech surge” the Obama administration deployed to overcome the highly publicized problems with HealthCare.gov that emerged in October. The website’s initial rollout will long stand as a monument to how badly technology contracting can go wrong. But finding parallels to the HealthCare.gov meltdown requires no memory at all. Just as HealthCare.gov was filling the headlines, a contractor for the Georgia Department of Human Services was neglecting to send renewal notices to the homes of some 66,000 food stamp recipients and about half that number of Medicaid beneficiaries. On Nov. 1, the state’s computer system — which goes by the Orwellian acronym Success — automatically terminated benefits to all those affected for failure to cooperate with reviews they had never been told were underway. In December, a Massachusetts contractor sent thousands of people, many of whom were elderly or had disabilities, new electronic food stamp benefit cards and immediately deactivated their old cards — without waiting to see if the new ones had arrived in the mail. Many had not. In mid-October, a contractor’s glitch made food stamps inaccessible to recipients in 17 states.
$292 Million Down The Drain: White House Fires Main Obamacare IT Contractor - Proving once again that if you want something done wrong, and preferably at massive cost overruns, then just leave it to the government, moments ago news broke that the main IT contractor behind the embarrassment that is healthcare.gov - CGI Federal - has been fired. Who could possibly foresee this? Well, anyone who had actually done some diligence on the clusterfuck that is CGI Federal, and which as WaPo profiled some time ago, "is filled with executives from a company that mishandled at least 20 other government IT projects, including a flawed effort to automate retirement benefits for millions of federal workers, documents and interviews show." Make that 21. "A year before CGI Group acquired AMS in 2004, AMS settled a lawsuit brought by the head of the Federal Retirement Thrift Investment Board, which had hired the company to upgrade the agency’s computer system. AMS had gone $60 million over budget and virtually all of the computer code it wrote turned out to be useless, according to a report by a U.S. Senate committee." Sounds like the perfect people to hire in order to make a complete disaster out of the Obamacare portal - almost as if by design. But the best news? Obama's little tryst with CGI Federal cost US taxpayers only $292 million. As Vanity Fair revealed recently, "According to congressional testimony, CGI stands to be paid $292 million for its work on healthcare.gov." And since the CGI replacement will eventually redo everything from scratch, this is $292 million that Obama may have as well burned.
On the Horizon after Obamacare - Many of us have talked about bending the healthcare cost curve by changing the services for fee healthcare cost model to a model of better outcomes for those fees. This is precisely what the PPACA does. Much of the cost savings will come from a consolidated healthcare industry delivery. STR has pointed out a few times without explanation the issue of consolidation within the healthcare industry, which if left unchecked, will cause its cost to increase. Both Phillip Longman and Paul Hewitt in a Washington Monthly article take-on the issue of healthcare industry consolidation “After Obamacare” and the monopolistic results. A keynote finding points to the future of America’s healthcare unless certain actions take place outside of the PPACA or whatever evolves. “A frenzy of hospital mergers could leave the typical American family spending 50 percent of its income on health care within ten years – and blaming the Democrats. The solution requires banning price discrimination by monopolistic hospitals.” As it stands and even with its faults, the PPACA is a viable solution to many of the issues faced by many of the uninsured and under insured; but in itself, it only addresses the delivery half of the healthcare problem. The other half of the problem rests with the industry delivering the healthcare and the control of pricing through the inherent monopolistic power coming pushing the industry into greater integration of delivery. As Longman and Hewitt posit “the message from Department of Health and Human Services stresses the vast savings possible through a less ‘fragmented’ and more ‘integrated’ health care delivery system. With this vision in mind, HHS officials have been encouraging health care providers to merge into so-called accountable care organizations, or ACOs; while on the other side of Mall, “pronouncements from the FTC are about the need to counter the record numbers of hospitals and doctors’ practices that are merging and using their resulting monopoly power to drive up prices.”
Obamacare Without The Individual Mandate - The standard story about Obamacare has two steps: (1) We need young people to join so that average costs are low. Prices will reflect average cost because of insurer competition and so healthy young people will cross subsidize less healthy older people. (2) This cross subsidy will only operate if the young get Obamacare. They may not because the price is greater than their payoff from going without insurance. Hence, the individual mandate is necessary to hold this together. If the tax is too small or the website failure too forbidding, young people will not join and the whole thing will collapse as adverse selection drives up prices and further reduces participation etc – the so-called “death spiral”. But this story is persuasive if young and old people are in the same pool. Obamacare allows pricing based on age so young and old people are in different pools. The young do not subsidize the old. If the young do not get Obamacare the old still get their insurance and they can live happily ever after (or at least get statins and heart bypasses). At a second cut there is a bit of a cross subsidy because Obamacare imposes a 3-to-1 ratio on prices of older age groups versus new. If this constraint does not bind, no problem. Even if it binds, it is relaxed if the young do not participate in their pool so prices go up in that pool allowing higher prices in the older pools.Still, within a fixed age based pool there can be adverse selection. How big is it? There is a working paper by Handel, Hendel and Whinston that gives us an idea. There is an impact of adverse selection because at least when you allow just two plans, one covering 90% of costs and the other 60%, only the latter trades. But what happens if you also drop the individual mandate? The last column of Table 12 on page 41 gives their forecast based on their model and the data. Participation is 87%-90% for those 50 and older. But is only 63-70% for those 25-40.
For Employer Provided Insurance the Healthy Already Subsidize the Sick --- Sarah Kliff has a useful discussion of the changes in the insurance market brought about by Obamacare. It points out that Obamacare will end discrimination based on pre-existing conditions. While there will still be substantial differences in cost based on age, people will pay the same premiums regardless of their health. However the piece is a bit misleading in its exclusive focus on the individual insurance market. The vast majority of the working age population gets insurance through their employer. With employer based insurance workers effectively pay the same for their insurance regardless of their health. (The premium paid by the employer is ultimately paid by the worker, since it comes out of wages. Employers don't just give away insurance.) This is important in the context of the debate around Obamacare since there has been considerable attention given the fact that the young to some extent subsidize the old, since the premium structure does not fully reflect the differences in average costs by age. Insofar as this cross-subsidy exists, Obamacare is just replicating a situation that has long been present in the much larger employer provided insurance system.
Report Finds More Flaws in Digitizing Patient Files - Although the federal government is spending more than $22 billion to encourage hospitals and doctors to adopt electronic health records, it has failed to put safeguards in place to prevent the technology from being used for inflating costs and overbilling, according to a new report by a federal oversight agency. The report, released on Wednesday by the Office of the Inspector General for the Health and Human Services Department, is the second in two months to warn about flaws in the oversight of the ambitious federal program aimed at converting patient records from paper to electronic. It comes as the Obama administration continues to face broad criticism over the troubled rollout of its health care law — especially the HealthCare.gov site. Despite spending “considerable resources to promote widespread adoption of E.H.R.’s,” or electronic health records, the government has “directed less attention to addressing potential fraud and abuse,” according to the report. Medicare has not changed the way it tries to detect fraud and has provided its contractors “with limited guidance,” the report said. The report was especially critical of the lack of guidelines around the widely used copy-and-paste function, also known as cloning, available in many of the largest electronic health record systems. The technique, which allows information to be quickly copied from one document to another, can reduce the time a doctor spends inputting patient data. But it can also be used to indicate more extensive — and expensive — patient exams or treatment than actually occurred. The result, some critics say, is that hospitals and doctors are overcharging Medicare for the care they are providing. While the report did not estimate the amount of fraud that may be occurring, earlier government estimates have said it could run in the hundreds of millions of dollars.
What happened to US life expectancy? - Here’s another chart from the JAMA study “The Anatomy of Health Care in the United States”: Why did the US fall behind the OECD median in the mid-1980s for men and the early 1990s for women? Note, the answer need not point to the health system. But, if it does, it’s not the first chart to show things going awry with it around that time. Before I quote the authors’ answer, here’s a related chart from the paper: The chart shows years of potential life lost in the US as a multiple of the OECD median and over time. Values greater than 1 are bad (for the US). There are plenty of those. A value of exactly 1 would mean the US is at the OECD median. Below one would indicate we’re doing better. There’s not many of those. It’d be somewhat comforting if the US at least showed improvement over time. But, by and large, it does not. For many conditions, you can see the US pulling away from the OECD countries beginning in/around 1980 or 1990, as was the case for life expectancy shown above. Why? The authors’ answer: Possible causes of this departure from international norms were highlighted in a 2013 Institute of Medicine report and have been ascribed to many factors, only some of which are attributed to medical care financing or delivery. These include differences in cultural norms that affect healthy behaviors (gun ownership, unprotected sex, drug use, seat belts), However, the breadth and consistency of the US underperformance across disease categories suggests that the United States pays a penalty for its extreme fragmentation, financial incentives that favor procedures over comprehensive longitudinal care, and absence of organizational strategy at the individual system level.
Diabetics May Be Getting Sick Because They Can’t Afford Food -- An inability to afford food might contribute to a diabetic’s risk of being hospitalized, a new study published in Health Affairs suggests. In an innovative analysis of health disparities between rich and poor, researchers from the University of California, San Francisco studied how often people with diabetes were hospitalized for low blood sugar by examining hospital admissions records and calculating household income using zipcode information and IRS data. They found a 27% increase in the number of diabetics admitted to the hospital for hypoglycemia, a potentially deadly condition, at the end of the month compared to the beginning — but only if they were from low-income households. Admissions weren’t any different between the beginning and end of the month for high-income individuals. The researchers speculate that low-income individuals are more likely to have difficulty buying food at the end of the month, which also is the end of the pay cycle for many people. When diabetics reduce the amount they are eating, but continue taking their diabetes drugs — which lower blood sugar — as usual, their risk of hypoglycemia increases. About 1 in 7 households in the U.S. worry about their ability to afford food.
Flu pandemic quickly spreads across US, killing children and adults - Influenza activity has been recorded in all parts of the United States, with half of the country reporting widespread outbreaks attributed to H1N1, the virus that caused a worldwide pandemic in 2009-2010 and resulted in an estimated 284,000 people died.Thousands of people die every year from the flu, which peaks in the United States between October and March, hitting the hardest in January and February.Texas has been the most affected so far, with at least 25 people dying this season from the flu, according to the Texas Department of State Health Services, while North Carolina has already reported 13 deaths, according to the state's Department of Health and Human Services, and two people have died in Salt Lake City.Nationally six children have died, the latest report from Centers for Disease Control and Prevention
H5N1 bird flu death confirmed in Alberta, 1st in North America - Alberta health officials have confirmed an isolated, fatal case of H5N1 or avian influenza, federal Health Minister Rona Ambrose said Wednesday. But officials repeatedly emphasized that there is no risk of transmission between humans. The infected woman, an Alberta resident who recently travelled to Beijing, China, died Jan. 3. The case was confirmed in a lab test last night. It's the first such case in North America.The woman first showed symptoms of the flu on a Dec. 27 flight from Beijing to Vancouver aboard Air Canada flight 030. She continued on to Edmonton on Air Canada flight 244, after spending a few hours in the Vancouver airport, and was admitted to hospital Jan. 1. The symptoms of fever, malaise and headache worsened and the she died two days later. The Public Health Agency of Canada was notified Jan. 5. There were no respiratory symptoms, said Dr. James Talbot, Alberta's chief medical officer of health.
Health Officials Respond to Beach Radiation Scare - An amateur video of a Geiger counter showing what appear to be high radiation levels at a Coastside beach has drawn the attention of local, state and federal public health officials. Since being posted last week, the short video has galvanized public concerns that radioactive material could be landing on the local coastline after traveling from Japan as a result of the 2011 meltdown of the Fukushima Daiichi reactors. Government officials say they are looking into the video shot on Dec. 23 and performing their own sampling of the beaches, but they have found no indication so far that radiation levels were hazardous. First posted last week on YouTube, the seven-minute video shows the meter of a Geiger counter as an off-camera man measures different spots on the beach south of Pillar Point Harbor. The gadget’s alarm begins ringing as its radiation reading ratchets up to about 150 counts per minute, or roughly five times the typical amount found in the environment.County health officials first learned of the radiation levels last week, and they sent their own inspector on Dec. 28 to Pacifica with a Geiger counter. Using a different unit, the county inspector measured the beach to have a radiation level of about 100 micro-REM per hour, or about five times the normal amount. REM stands for “Roentgen equivalent man,” a measurement of the dosage and statistical biological effects presented by radiation. Although the radiation levels were clearly higher than is typical, Peterson emphasized that it was still not unsafe for humans. A person would need to be exposed to 100 microREMs of radiation for 50,000 hours before it surpassed safety guidelines by the Occupational Safety and Health Administration, he explained. Peterson admitted he was “befuddled” as to why radiation levels were higher than normal, but he was skeptical that the Fukushima meltdown could be the cause.
U.S. Government Purchases Millions of Potassium Iodide Pills to combat nuclear radiation from Fukushima Fallout raining down on the West Coast -- The Department of Health and Human Services, has ordered 14 million doses of potassium iodide, the compound that protects the body from radioactive poisoning in the aftermath of severe nuclear accidents, to be delivered before the beginning of February. According to a solicitation posted on the Federal Business Opportunities website, the DHHS asks contractors to supply, “potassium iodide tablet, 65mg, unit dose package of 20s; 700,000 packages (of 20s),” a total of 14 million tablets. The packages must be delivered on or before February 1, 2014. Potassium iodide helps block radioactive iodine from being absorbed by the thyroid gland and is used by victims of severe nuclear accidents or emergencies. Under current regulations, states with populations living within 10 miles of a nuclear plant are encouraged, but not required, to maintain a supply of potassium iodide. If you live in the West Coast near the sea, don’t wait for the government issue. Start taking simple Iodine from seaweed, which is also a good way to fill up your thyroid gland now — and avoid absorbing the irradiated kind from the atmosphere, water, food and air.
West Virginia Declares State Of Emergency After Coal Chemical Contaminates Drinking Water - Residents of nine counties in West Virginia have been told not to use or drink their water after a chemical used by the coal industry spilled into the Elk River on Thursday. Gov. Earl Ray Tomblin declared a state of emergency as more than 100,000 customers, or 300,000 people, are without safe drinking water. “Don’t make baby formula,” said West Virginia American Water Company president Jeff McIntyre. “Don’t brush your teeth. Don’t shower. Toilet flushing only.” The chemical, 4-Methylcyclohexane Methanol (MCHM), is used to wash coal of impurities and spilled from a tank at Freedom Industries into the river. While the amount of MCHM that spilled wasn’t immediately known, West Virginia American Water has been conducting water quality testing every hour. According to Laura Jordan, a spokesperson with the water company, they believe the chemical is leaking at ground level and “there is a possibility this leak has been going on for sometime before it was discovered Thursday,” WSAZ reported. Local officials described MCHM as smelling like licorice and looking like “cooking oil floating on top of the water.” The West Virginia Department of Health and Human Resources said symptoms of MCHM exposure include “severe burning in throat, severe eye irritation, non-stop vomiting, trouble breathing or severe skin irritation such as skin blistering.” Though the spill occurred Thursday morning, West Virginia American Water didn’t provide its customers with a warning until evening and, as Al Jazeera reported, several were angered by the lack of information, particularly regarding what should be done if they had already used or ingested the water. Early Friday, Tomblin announced that the White House approved a federal emergency declaration to help with the urgent water situation. Soon after the governor’s declaration on Thursday, residents flooded local stores for bottled water and disposable dishes.
Crisis In West Virginia: Wal-Mart Calls In Police To Guard Bottled Water Delivery -- The Federal Emergency Management Authority has confirmed that it will deliver more than 1 million liters (264,172 gallons) of clean water to residents of the nine counties in West Virginia after a chemical used by the coal industry spilled into the Elk River on Thursday. Approximately 300,000 people in West Virginia were told not to drink or use their water after approximately 5,000 gallons of 4-Methylcyclohexane Methanol (MCHM) — a chemical used to wash coal of impurities — spilled from a tank owned by Freedom Industries. West Virginia American Water Company president Jeff McIntyre warned consumers not to use tap water for baby formula, brushing teeth, or showering. “Toilet flushing only,” he said. The reports sent people rushing to stock up on bottled water, stripping store shelves around the area, including local Wal-Marts. Tension over the availability of clean water in the area seemed to be growing. At around 3:00pm, the Kanawha County police scanner lit up with reports of a shipment of water that was about to come in to a nearby Wal-Mart, asking for police presence while employees could restock. “It was chaos, that’s what it was,”
Truth in advertising: Are there really any federal budget savings in a new Farm Bill? - Congressional leaders are seeking ways to offset the increases in spending that would occur were federal benefits for the long term unemployed to be extended for several months. Some have suggested those savings could come from reductions in farm subsidies embedded in a new farm bill. Yesterday, for example, Senator Grassley (R-IA), a long-time member of the Senate Agriculture Committee, was quoted as saying: “We aren’t having direct payments because you can’t justify them when farm prices have been so high—here prior to right now—and we did it to save five billion dollars a year. I think that unemployment needs to be offset, but it ought to be offset with cuts in spending someplace else.” The Direct Payments program, introduced in 1996, is the program that currently sends welfare checks to farmers each year on the basis of what their farms produced 30 years ago Senator Grassley is correct in claiming that terminating the Direct Payments program would save about $5 billion a year in subsidy payments, as long as a related program called ACRE is also discontinued. What he doesn’t mention is that the new farm bill about to be released by the bipartisan Senate and House Conference Committee would introduce four new subsidy programs.
USDA Expects to Approve Agent Orange GMOs - The USDA has issued an Environmental Impact Statement (EIS) and announced that following a 45-day public comment period it expects to approve Dow’s line of GMO crops resistant to the herbicide 2,4-D. This poison is one of the two main constituents of the infamous chemical weapon Agent Orange. Up for approval are one maize variety and two varieties of soybeans. This impetuous approval process, taking less than eight months to draw up such an allegedly rigorous EIS, is part of the Obama administration’s drive to “streamline”, i.e. accelerate, what was already the USDA’s rubber-stamp procedure for deregulating GMOs. As always, we see how Obama is the most aggressively pro-Monsanto president yet. This approval and the huge surge in 2,4-D use that will follow comprise a major escalation of an already insane and failed policy. These GMOs, manufactured by Dow and called the “Enlist” series, are part of what’s being touted as “second generation” herbicide resistant GMOs. . “Second generation” is a marketing term meant to obscure the fact that these are the same highly toxic and environmentally reckless herbicides which cartel and government propaganda originally promised would be rendered obsolete by glyphosate-resistant GMOs. What happened instead? Like clockwork, this unrelenting, unabated slathering of one poison encouraged the target weeds themselves to become resistant to glyphosate. Today glyphosate-resistant superweeds are a major, chronic, spreading problem, unsolvable by the industrial agriculture methods which created it. . Monsanto no longer legally warrants that Roundup will actually suppress weeds. Now we’ve come full circle. 2,4-D and dicamba, originally relegated by GMO propaganda to history’s garbage heap, are now touted as the solution to the artificial problem of glyphosate’s collapse.The Enlist crops are “stacked” varieties, resistant to both 2,4-D and glyphosate. So when the Agent Orange crops are grown, they’ll still be drivers of the escalating use of glyphosate, and will add a massive surge in 2,4-D application on top of the massive glyphosate use.)
Pesticide 'contaminating' Prairie wetlands: scientist - A University of Saskatchewan biologist says many wetlands across the Prairies are being contaminated by a relatively new pesticide that is threatening the ecosystem.Christy Morrissey says that over the past few years neonicotinoids have been used increasingly on crops in Western Canada and the chemical is making its way into wetlands, potentially having a devastating "domino effect" on insects and the birds that rely on them.Morrissey is just a year and a half into a four-year study, but she's alarmed by what she's finding. "This is huge" Morrissey said. "The impact on biodiversity could be probably bigger than we've ever seen before if we keep going at this rate." Neonics, as they're commonly called, hit the market in the early 2000s, but sales have taken off over the past five years. They're used on a wide variety of crops such as corn, soybeans, wheat, oats, barley, potatoes and fruit. In Western Canada, neonics are most commonly found on canola. Virtually all of the 8.5 million hectares of canola planted in Saskatchewan, Manitoba and Alberta are now treated with them.Based on confidential data obtained from the federal government, Morrissey said her conservative estimate is 44 per cent of crop land in the Prairies was treated with neonics in the year she reviewed."We're not talking about a little regional problem. We're talking about something that's happening over tens of millions of acres." Morrissey said her study is the first in Canada looking at how the widespread use of this chemical may be affecting wetlands across the Prairies.
Pesticide residue found on nearly half of organic produce -- Nearly half the organic fresh fruits and vegetables tested across Canada in the past two years contained pesticide residue, according to a CBC News analysis of data supplied by the Canadian Food Inspection Agency (CFIA). Of the 45.8 per cent of samples that tested positive for some trace of pesticide, a smaller amount — 1.8 per cent — violated Canada’s maximum allowable limits for the presence of pesticides, the data shows. The data released to CBC News under the federal Access to Information Act includes testing of organic fruits and vegetables sampled between September 2011 and September 2013. As widespread as the pesticide residues were, they were still considerably less than the 78.4 per cent of non-organic samples the inspection agency found containing pesticide residues, violating the allowable limits 4.7 per cent of the time.
Syngenta, DuPont, Monsanto Agree: GM Isn’t Needed and Doesn’t Work For Drought Resistance - The notion of “drought-resistant GMOs” is one of the most prevalent PR scams found in pro-GMO propaganda. Along with similar hoaxes like golden rice and the GM Kenyan sweet potato, the purpose of the drought-resistant GMO trope is to misdirect attention from the fact that GMOs were created for no reason other than to sell poison. The two kinds of GMOs which actually exist on a practical level are those tolerant of herbicides, and those which generate their own Bt insecticidal poison in every plant cell. Drought-resistance, on the other hand, along with traits like pest and disease resistance, salt tolerance, improved nutrition, and improved nitrogen uptake, is solely the province of non-GM conventional breeding. This breeding, like any other, builds upon the accumulated work of thousands of years of farmer breeding, a collective human heritage. This paradigm was reinforced in the 20th century, as all significant modern crop breeding was done using public money. So anything today’s corporations do with this heritage is at best a miniscule contribution to a monumental and ongoing collective human project. That’s part of the reason it’s morally and rationally impossible for seed patents to have any legitimacy. At best modern breeding is a man standing on the shoulder of a giant. This “at best” is 100% within the realm of non-GM conventional breeding. A “drought-resistant” GMO, on the other hand, is nothing but a drought-resistant conventional variety which has one or more of the poison-enabling transgenes inserted. Thus we have the conventionally drought-resistant variety with an added Roundup Ready and/or Bt trait extraneously added. This is then fraudulently called a “drought-resistant GMO.” The GMO cartel itself acknowledges this, and specifically that drought-resistant maize is a non-GM achievement. Thus Syngenta’s Agrisure Artesian drought-resistant maize was developed using conventional breeding, including marker-assisted selection which uses the most modern technology to more easily identify genetic traits, but has nothing to do with genetic modification. Pioneer and Monsanto’s varieties are similarly 100% conventional.
Robust network of insect pollinators may collapse suddenly, study finds - The global decline of bees, hoverflies and other pollinators pose a serious threat to food security and biodiversity. A team of scientists show that a further deterioration of conditions for pollinators may lead to the sudden extinction of numerous species. Many plant species depend for the production of seed and fruit upon pollinators that carry pollen grains from flower to flower. Plants are visited by a large number of pollinator species and pollinators visit many different plant species. All these relations together form a robust network of interactions between plants and pollinators. These networks have a characteristic structure that is similar in very different natural landscapes, such as rainforests and river deltas, as well as in human-dominated landscapes with orchards, fields and meadows. Worldwide, pollinators are under pressure from insecticides, loss of habitat, parasites and disease. These drivers of pollinator decline make it increasingly difficult for pollinators to survive. The scientists of Wageningen University show, with the help of mathematical models, that the implications of a further deterioration of conditions for pollinators, is strongly influenced by the way in which interaction networks are put together. Due to the structure of these networks, pollinator species support each other under difficult circumstances. Pollinator species that live in the same area may therefore maintain themselves under more difficult conditions. Tipping point Pollinator species are, however, also highly dependent on each other when circumstances are harsh. The pollinator community, consisting of bees, butterflies, hoverflies and many other species, may therefore collapse entirely when increasingly harsh conditions pass a critical point. Recovery after conditions have past such a tipping point might not be easy. The required improvement in conditions could be substantially larger than what is needed to return to conditions at which the pollinator community collapsed.
World Food Prices Dropped Last Year - World food prices fell by 1.6% in 2013, down 8.8% from their all-time peak in 2011, driven by falling international prices for grains, sugar and palm oil, according to the United Nations’s Rome-based Food and Agriculture Organization Thursday. The Food and Agriculture Organization’s monthly index measures the monthly change in international prices of a basket of food commodities and is the global leading economic indicator for food prices. While the most recent food price spike in 2011 was triggered by a lack of cereal supply, the recent fall in food prices is mainly due to higher expected supplies of corn and wheat this year. The sharp increase in 2013 cereal production is due to a rebound in the U.S. corn crop and record wheat harvests in countries in the Commonwealth of Independent States. Favorable weather in several leading producer nations such as the U.S. has boosted hopes of significant increases in corn output and led the U.S. Department of Agriculture to forecast a record U.S. corn crop for this agricultural season. Global cereal stocks are thus anticipated to increase 13% in 2013 to 564 million metric tons, according to U.N. data. The current outlook for grains marks a drastic turnaround since 2012 after extreme heat and dryness across the U.S. corn belt meant fields baked under relentless sunshine, with the result that both corn and wheat prices soared. Rising food prices also helped spark the unrest–known as the Arab Spring–that analysts say ultimately ousted the leaders of Tunisia, Egypt and Libya. Still, an uptick in both dairy and meat prices late last year limited the slide, warns the U.N. Both dairy and meat prices hit record highs because of drought in the world’s top milk exporter New Zealand and strong demand for meat from Asia.
California Researchers Find Drastically Low Snowpack, Spelling Danger For 2014 Water Supplies - Snow surveyors went into the Sierra Nevada mountains on California’s northeastern border on Friday to take their first measurement of the season. They found snowpack at one-fifth of normal for this time of year. The findings aren’t too surprising considering California was parched for water throughout 2013, with major metropolises like Los Angeles and San Francisco experiencing record-low precipitation. Los Angeles, which averages 14.74 inches of rain, ended the year with 3.4 inches. Currently, almost the entire state is gripped in drought. But the below average snowpack is an indicator of the water challenges 2014 is likely to bring. According to state resource managers, snowpack usually provides about one third of California’s annual water use. This year, it is more likely to account for about one twentieth. “While we hope conditions improve, we are fully mobilized to streamline water transfers and take every action possible to ease the effects of dry weather on farms, homes and businesses as we face a possible third consecutive dry year,” Department of Water Resources Director Mark Cowin said in a written statement. There is still hope, and time for rain dances or prayers. Big winter storms often happen in California, and a few of those can turn a dry year into an average, or even a wet, one. However, considering this is California’s third straight dry year — and that climate change is projected to make the region more arid — state water managers are preparing for the driest.
Colorado River Drought Forces a Painful Reckoning for States - The once broad and blue river has in many places dwindled to a murky brown trickle. Reservoirs have shrunk to less than half their capacities, the canyon walls around them ringed with white mineral deposits where water once lapped. Seeking to stretch their allotments of the river, regional water agencies are recycling sewage effluent, offering rebates to tear up grass lawns and subsidizing less thirsty appliances from dishwashers to shower heads. But many experts believe the current drought is only the harbinger of a new, drier era in which the Colorado’s flow will be substantially and permanently diminished. Faced with the shortage, federal authorities this year will for the first time decrease the amount of water that flows into Lake Mead, the nation’s largest reservoir, from Lake Powell 180 miles upstream. That will reduce even more the level of Lake Mead, a crucial source of water for cities from Las Vegas to Los Angeles and for millions of acres of farmland. Reclamation officials say there is a 50-50 chance that by 2015, Lake Mead’s water will be rationed to states downstream. That, too, has never happened before. “If Lake Mead goes below elevation 1,000” — 1,000 feet above sea level — “we lose any capacity to pump water to serve the municipal needs of seven in 10 people in the state of Nevada,” said John Entsminger, the senior deputy general manager of the Southern Nevada Water Authority.
West Coast sardine crash could radiate throughout ecosystem - latimes.com: The sardine fishing boat Eileen motored slowly through moonlit waters from San Pedro to Santa Catalina Island, its weary-eyed captain growing more desperate as the night wore on. After 12 hours and $1,000 worth of fuel, Corbin Hanson and his crew returned to port without a single fish. "Tonight's pretty reflective of how things have been going," Hanson said. "Not very well." To blame is the biggest sardine crash in generations, which has made schools of the small, silvery fish a rarity on the West Coast. The decline has prompted steep cuts in the amount fishermen are allowed to catch, and scientists say the effects are probably radiating throughout the ecosystem, starving brown pelicans, sea lions and other predators that rely on the oily, energy-rich fish for food. If sardines don't recover soon, experts warn, the West Coast's marine mammals, seabirds and fishermen could suffer for years. The reason for the drop is unclear. Sardine populations are famously volatile, but the decline is the steepest since the collapse of the sardine fishery in the mid-20th century. And their numbers are projected to keep sliding.
Research cutbacks by government alarm scientists - Scientists across the country are expressing growing alarm that federal cutbacks to research programs monitoring areas that range from climate change and ocean habitats to public health will deprive Canadians of crucial information. “What’s important is the scale of the assault on knowledge, and on our ability to know about ourselves and to advance our understanding of our world,” said James Turk, executive director of the Canadian Association of University Teachers. In the past five years the federal government has dismissed more than 2,000 scientists, and hundreds of programs and world-renowned research facilities have lost their funding. Programs that monitored things such as smoke stack emissions, food inspections, oil spills, water quality and climate change have been drastically cut or shut down. This week, scientists went public with concerns that irreplaceable science could be lost when Department of Fisheries and Oceans (DFO) libraries are closed. DFO plans to shut down seven of its 11 libraries by 2015. Already, stories have emerged about books and reports thrown into dumpsters and the general public being allowed to rummage through bookshelves.
Canadian Government Dismantles Ecological Libraries After Dismissing Thousands Of Scientists - Climate change is a complex, dynamic, and sometimes polarizing issue. Libraries, on the other hand, are an established democratic institution meant to bring people together and facilitate the sharing of information. However, the Canadian government, led by Prime Minister Stephen Harper, has managed to inject libraries into the broader national debate and make them a controversial focal point in a larger polemic between environmental concerns and natural resource development. His administration’s agenda of closing renowned fisheries and oceans libraries along with cutting back scientific funding for important environmental research is experiencing a bout of attention as the reality of certain libraries emptying their shelves comes into public view.The Canadian government is closing seven of the eleven Department of Fisheries and Oceans libraries across the country in what they deem a cost-cutting measure. Government officials promised that critical materials wouldn’t be lost, but would instead be digitized, offering greater access. However a document classified as “secret” that was obtained by Postmedia News mentioned “culling of materials” as a main activity in the reduction of libraries. As some of the libraries proceed through the shutdown process, reports have emerged of books being strewn across floors and even piled into dumpsters. One reddit user described the closing process as hectic and rushed, saying, “What really annoys me, is that they could have both saved costs and saved the books for free:” “I worked for a gov’t agency that had to get rid of its library, due to the costs. They donated all the books to the local university’s library. The University gave all the employees library cards. Simple. Why the heck would they think the best solution is to trash the books!?”
How the Harper government committed a knowledge massacre, complete with book burnings - Scientists are calling it "libricide." Seven of the nine world-famous Department of Fisheries and Oceans [DFO] libraries were closed by autumn 2013, ostensibly to digitize the materials and reduce costs. But sources told the independent Tyee in December that a fraction of the 600,000-volume collection had been digitized. And, a secret federal document notes that a paltry $443,000 a year will be saved. The massacre was done quickly, with no record keeping and no attempt to preserve the material in universities. Scientists said precious collections were consigned to dumpsters, were burned or went to landfills. Probably the most famous facility to get the axe is the library of the venerable St. Andrews Biological Station in St. Andrews, New Brunswick, which environmental scientist Rachel Carson used extensively to research her seminal book on toxins, Silent Spring. The government just spent millions modernizing the facility. Also closed were the Freshwater Institute library in Winnipeg and the Northwest Atlantic Fisheries Centre in St. John's, Newfoundland, both world-class collections. Hundreds of years of carefully compiled research into aquatic systems, fish stocks and fisheries from the 1800s and early 1900s went into the bin or up in smoke. Irreplaceable documents like the 50 volumes produced by the H.M.S. Challenger expedition of the late 1800s that discovered thousands of new sea creatures, are now moldering in landfills. Renowned Dalhousie University biologist Jeff Hutchings calls the closures "an assault on civil society." "It is always unnerving from a research and scientist perspective to watch a government undermine basic research. Losing libraries is not a neutral act," Hutchings says. He blames political convictions for the knowledge massacre.
'Historic and life-threatening' freeze brings rare danger warning (CNN) -- On Monday morning, Nashville was 40 degrees colder than Albany, New York. Memphis, Tennessee, was 20 degrees colder than Anchorage, Alaska. And Atlanta was colder than Moscow. But the U.S. South was downright balmy compared to the Great Lakes region, where temperatures hovered in the negative 20s -- before wind chill, which dropped temps to the negative 50s, making it very dangerous to go outside. The bitter cold that a "polar vortex" is pushing into much of the United States is not just another winter storm. It's the coldest in 20 years in many areas, and breaking some records. More than 3,500 flights nationwide were canceled by noon ET Monday, according to flightaware.com. Illinois Gov. Pat Quinn declared a statewide disaster and activated the Illinois National Guard to help provide aid. 8 tips to ease winter travel woes While the current weather patterns gave the Northeast a bit of a reprieve, it's in for a brutal drop as the arctic air works its way east. New York, where it was about 50 degrees with wind chill Monday morning, could go as low as minus 7 on Tuesday, said CNN meteorologist Indra Petersons. The region could face a 60-degree temperature change in a single day
Winter Does Not Disprove Global Warming - So just a few brief observations:
- 1. Statements about climate trends must be based on, er, trends. Not individual events or occurrences. Weather is not climate, and anecdotes are not statistics.
- 2. Global warming is actually expected to increase “heavy precipitation in winter storms,” and for the Northern Hemisphere, there is evidence that these storms are already more frequent and intense, according to the draft U.S. National Climate Assessment.
- 3. Antarctica is a very cold place. But global warming is affecting it as predicted: Antarctica is losing ice overall, according to the latest report of the Intergovernmental Panel on Climate Change. However, sea ice is a different matter than land-based or glacial ice. Antarctic sea ice is increasing, and moreover, the reason for this may be climate change! (For more, read here.)
- Finally, just one last thing: When it’s winter on Earth, it’s also summer on Earth ... somewhere else. Thus, allow us to counter anecdotal evidence about cold weather with more anecdotal evidence: It’s blazing hot in Australia, with temperatures in some regions set to possibly soar above 120 degrees Fahrenheit in the coming days.
New Study Suggests Future Global Warming at the Higher End of Estimates: 4°C Possible by 2100 - In everyday terms, climate sensitivity refers to the amount of warming of global surface temperatures with a doubling of atmospheric carbon dioxide - a potent planet-warming greenhouse gas emitted by human industrial activity. In practice, establishing Earth's actual climate sensitivity has proven very problematic.However, a research paper just published, Sherwood (2014), suggests that climate sensitivity of relevance today is in excess of 3°C - near the upper range of estimates from the latest IPCC report. Climate models exhibit a large range of climate sensitivities and the main reason for this is down to the way that each model handles cloud feedback. In brief: an increase in cloud cover in response to global warming would act as a negative (counteracting) feedback - reflecting more sunlight back out to space and thereby cooling the Earth, whereas a decline in cloud cover would act as a positive (reinforcing) feedback - as more sunlight reaches the Earth's surface and this leads to greater warming. The authors of Sherwood (2014) looked at the way that the various climate models handled the cloud feedback and found models with a low climate sensitivity were inconsistent with observations. It turns out that these models were incorrectly simulating water vapour being drawn up to higher levels of the atmosphere to form clouds in a warmer world. In reality (based on observations) warming of the lower atmosphere pulls water vapour away from those higher cloud-forming levels of the atmosphere and the amount of cloud formation there actually decreases. The diminished cloud cover leads to greater warming (a positive feedback).
Climate Change Worse Than We Thought, Likely To Be 'Catastrophic Rather Than Simply Dangerous -- Climate change may be far worse than scientists thought, causing global temperatures to rise by at least 4 degrees Celsius by 2100, or about 7.2 degrees Fahrenheit, according to a new study. The study, published in the journal Nature, takes a fresh look at clouds' effect on the planet, according to a report by The Guardian. The research found that as the planet heats, fewer sunlight-reflecting clouds form, causing temperatures to rise further in an upward spiral. That number is double what many governments agree is the threshold for dangerous warming. Aside from dramatic environmental shifts like melting sea ice, many of the ills of the modern world -- starvation, poverty, war and disease -- are likely to get worse as the planet warms. "4C would likely be catastrophic rather than simply dangerous," lead researcher Steven Sherwood told the Guardian. "For example, it would make life difficult, if not impossible, in much of the tropics, and would guarantee the eventual melting of the Greenland ice sheet and some of the Antarctic ice sheet." Another report released earlier this month said the abrupt changes caused by rapid warming should be cause for concern, as many of climate change's biggest threats are those we aren't ready for. In September, the Intergovernmental Panel on Climate Change said it was "extremely likely" that human activity was the dominant cause of global warming, or about 95 percent certain -- often the gold standard in scientific accuracy.
Nature Bombshell: Observations Point To 10°F Warming by 2100 - A major new study in Nature finds “our climate is more sensitive to carbon dioxide than most previous estimates.” The result, lead author Steven Sherwood told me, is that on our current emissions path we are headed toward a “most-likely warming of roughly 5°C [9°F] above modern [i.e. current] temperatures or 6°C [11°F] above preindustrial” temperatures this century. This finding is consistent with paleoclimate data (see “Last Time CO2 Levels Hit 400 Parts Per Million The Arctic Was 14°F Warmer!”). Also, this study is consistent with other recent observation-based analyses (see “Observations Support Predictions Of Extreme Warming And Worse Droughts This Century”). This analysis throws more cold water (hot water?) on some recent claims that the climate’s sensitivity is on the low side, claims that have been widely challenged and perhaps fatally undermined by other recent studies. Prof. Sherwood explains in the news release: “Our research has shown climate models indicating a low temperature response to a doubling of carbon dioxide from preindustrial times are not reproducing the correct processes that lead to cloud formation.” “When the processes are correct in the climate models the level of climate sensitivity is far higher. Previously estimates of the sensitivity of global temperature to a doubling of carbon dioxide ranged from 1.5°C to 5°C. This new research takes away the lower end of climate sensitivity estimates, meaning that global average temperatures will increase by 3°C to 5°C with a doubling of carbon dioxide.”
‘It’s Not Too Late To Reverse The Alarming Trend Of Climate Change,’ Scientists Who Know It’s Too Late Announce - With the implementation of tighter carbon emissions caps and more responsible household energy use, it is not too late to reverse the dire course of global warming, a panel of scientists who know full well that it is far too late and we are all doomed told reporters today. “If we all do our part right now to design and enforce more responsible business and environmental practices, there’s still a good chance we can avoid the calamitous consequences of worldwide climate change,” said climatologist Dr. Kevin Little, a man who, deep in his heart, knows all too acutely that it’s over, there’s not a damned thing we can do, and so we might as well just start preparing now for what is certain to be the unprecedented destruction of human civilization at the hands of a ravaged ecosystem. “It will take massive investment and cooperation on a global scale, but I’m optimistic we can be in good shape by around 2030 or so.” The researchers who awake each morning with the grim realization that they are bearing witness to mankind’s sad, inevitable endgame also suggested there is still very much a chance of stabilizing the rapid loss of Arctic sea ice
Coastal dwellers should take their own chances - FT.com: For billions of years, the boundaries between sea and land have been in flux. The volume of water has risen and fallen in parallel with rises and falls in the temperature of the earth. And the topography of the land has changed as a result of earthquakes, tectonic shifts, and the deposit of sediment. Parts of the world that are land today were once sea, and parts that were once sea are now land. Until recently, minor shifts in the shoreline did not matter very much to the life of the planet. But now they do, for several more or less unrelated reasons. Some economic activities – such as building ports and catching sea fish – are necessarily conducted on the shoreline. The deltas of great rivers such as the Ganges, the Mississippi and the Rhine provide fertile agricultural land that supports a dense population. And people like living by the shore. Sea views and beachfront locations add greatly to the value of a house. The worst sea flooding western Europe has experienced for 50 years is a reminder that even modest and temporary advances of the sea can have substantial costs. No one wants the sea to advance. But almost nobody wants the sea to recede either. True, Holland and Monaco have recovered valuable land. But the beautiful Belgian city of Bruges was for several hundred years one of the great commercial centres of Europe, and lost that status when it ceased to be a port. Occupants of beachfront and sea-view residences want beach and sea to stay just where they are. So we have created powerful vested interests, businesses and property owners, who want the shoreline to remain unchanged in perpetuity. These lobbies want taxpayers’ money to be spent on achieving this outcome. Yet the history of the world tells us that this unnatural objective is likely to be formidably expensive even if it is technically possible. When the sea defies mankind’s efforts to keep it in place, the shore people want these costs, too, to fall on the public at large. In the aftermath of a disaster, it is difficult to argue with such demands. But when the storms have abated and calm returns, it is hard to see why those who cannot afford sea views and beachfront properties should subsidise those who can, or why commercial activities related to the sea should not meet the costs that proximity to the sea entails.
Talking Trash on Emissions -- While attending the recent AGU conference, some of us were struck by a statistic presented by Professor Richard Alley: On average, a person's contribution of carbon dioxide waste to the atmosphere is forty times greater than their production of solid trash to landfills when measured as mass. It can be difficult to grasp the huge quantities of CO2 that we emit. It’s an invisible gas with no odour and we are not used to thinking about amounts of gas in terms of mass. But we do have a good sense of how much solid waste we throw out, since we all have to lug our garbage to the curb. If we had to do the same with our greenhouse gases, instead of one can a week, we would have to haul forty. Every time we see a garbage truck, let’s imagine forty others following it, all taking our carbon dioxide to a dump site. When we hear of municipal politicians struggling to find new landfill sites, imagine the problems we would have finding forty subterranean landfill sites if we ever tried to dispose of our CO2 in the subsurface instead of dumping it freely into the air.
60 Minutes Hit Job On Clean Energy Ignores The Facts - Clean technology is booming by every key indicator — but you would never know that from Sunday’s absurd 60 Minutes piece touting an imaginary “Cleantech Crash.” As documented in the recent Department of Energy (DOE) report, “Revolution Now: The Future Arrives for Four Clean Energy Technologies”,” the only thing in cleantech that is crashing is the cost of key components. This price crash has enabled explosive growth in wind power, solar power, LED lights and electric vehicles, as shown in the four charts from the report reposted here. Ironically, this boom is so self-evident that just Saturday the New York Times published a front page story on “the solar power craze that is sweeping Wall Street.” As the article notes, “Solar companies have had the wind at their backs lately.” It’s true there have been some losers among cleantech companies, but that’s precisely what you would expect in an industry where the norm has become ruthless cost-cutting, which in turn is a great boon to consumers. But for 60 Minutes, this incredible boon is a bust. Here’s a transcript of a clip from the show: . But CBS explains that “the venture capital model is that for every 10 startups, nine go under” — except that CBS appears to see that as a bug, not a feature, failing to understand that the successes more than pay for the failures. Moreover, 60 Minutes is apparently unaware that the DOE Loan Guarantee Program has a whopping 97 percent success rate, while the companies CBS focuses on such as Solyndra and Abound Solar were just 3 percent of the portfolio.
Dirtiest Coal’s Rebirth in Europe Flattens Medieval Towns - Europe’s appetite for cheaper electricity is reviving mines that produce the dirtiest type of coal, threatening to boost pollution and raze villages that have survived since medieval times. Across the continent’s mining belt, from Germany to Poland and the Czech Republic, utilities such as Vattenfall AB, CEZ AS and PGE SA are expanding open-pit mines that produce lignite. The moist, brown form of the fossil fuel packs less energy and more carbon than more frequently burned hard coal. The projects go against the grain of European Union rules limiting emissions and pushing cleaner energy. Alarmed at power prices about double U.S. levels, policy makers are allowing the expansion of coal mines that were scaled back in the past two decades, stirring a backlash in the targeted communities. “It’s absurd,” said Petra Roesch, mayor of Proschim, a 700-year-old village southeast of Berlin that would be uprooted by Vattenfall’s mine expansion. “Germany wants to transition toward renewable energy, and we’re being deprived of our land.” Lignite demand worldwide is forecast to rise as much as 5.4 percent by 2020, according to the International Energy Agency. At the same time, it estimates consumption must fall 10 percent over that period to achieve goals endorsed by EU and world leaders to hold global warming to 2 degrees Celsius by the end of this century.
Green Capitalism: The God That Failed - And contrary to green capitalism proponents, across the spectrum from resource extraction to manufacturing, the practical possibilities for "greening" and "dematerializing" production are severely limited. This means the only way to prevent overshoot and collapse is to enforce a massive economic contraction in the industrialized economies, retrenching production across a broad range of unnecessary, resource-hogging, wasteful and polluting industries, even virtually shutting down the worst. Yet this option is foreclosed under capitalism because this is not socialism: No one is promising new jobs to unemployed coal miners, oil drillers, automakers, airline pilots, chemists, plastic junk makers and others whose jobs would be lost because their industries would have to be retrenched - and unemployed workers don't pay taxes. So CEOs, workers and governments find that they all "need" to maximize growth, overconsumption, even pollution, to destroy their children's tomorrows to hang onto their jobs today. If they don't, the system falls into crisis, or worse. So we're all on board the TGV of ravenous and ever-growing plunder and pollution. As our locomotive races toward the cliff of ecological collapse, the only thoughts on the minds of our CEOs, capitalist economists, politicians and most labor leaders is how to stoke the locomotive to get us there faster. Corporations aren't necessarily evil. They just can't help themselves.
Nuclear Fuel Storage Remains Safe, Panel Members Say — Most members of the Nuclear Regulatory Commission indicated on Monday that they considered it safe to continue storing most spent nuclear fuel in pools, even though concerns remain about potential accidents and terrorist attacks. .At a commission meeting, four of the five members indicated that storage in the pools was safe enough, at least compared with moving some of the fuel into giant steel and concrete casks, where they can be stored dry, with no reliance on water, pumps or filters to keep them cool. Concerns about the safety of spent fuel pools grew after the disaster at the Fukushima Daiichi nuclear power plant in Japan nearly three years ago, when the possibility of damage to a pool there led the State Department to advise Americans to stay more than 50 miles from the plant. Before then, the National Academy of Sciences, in a study ordered by a worried Congress after the attacks of Sept. 11, 2001, found that a successful terrorist attack on a spent fuel pool was plausible and that regulators should consider reducing the loading in spent fuel pools, which hold far more radioactive materials than nuclear reactors do. “It’s legitimate to describe spent fuel pools at reactors in the United States as pre-emplaced radiological weapons,”
Worker aghast at shoddy work on Fukushima radioactive water storage tanks - Yoshitatsu Uechi recalls with disgust the disregard for worker safety, the makeshift plans and the cost-cutting measures, including the use of adhesive tape on key equipment, at his job last year. He said an emphasis on saving time and expenses was clear when he helped to build storage tanks for radioactive water accumulating at the site of Japan’s worst-ever nuclear accident. “I couldn’t believe that such slipshod work was being done, even if it was part of stopgap measures,” Uechi told The Asahi Shimbun. He was one of 17 workers from Okinawa Prefecture who were sent to the crippled Fukushima No. 1 nuclear power plant on June 28, 2012. The 48-year-old from Uruma said he worked on foundations and storage tank assembly between July 2 and Dec. 6, 2012. He said he was sent to various places at the site, including “H3,” an area now known as the spot where high radiation levels have been found due to leaks of radioactive water from the storage tanks. The leaking tanks are just part of the problem of contaminated water that continues to build up and leak into the ocean from the plant.
Report: Fracking Operations Are Contaminating Well Water In 2 States - Complaints of water contamination in two states have been tied to oil or gas drilling, according to an Associated Press investigation. The AP looked at well water contamination complaints in Pennsylvania, Ohio, West Virginia and Texas and found that two states — West Virginia and Pennsylvania — had linked some complaints to fracking. In Pennsylvania, since 2005, more than 100 well-water contamination complaints have been confirmed, meaning that the well water in question was found by authorities to be polluted, There were nearly 900 complaints claiming that drilling operations had affected private well water in the state in 2012 and 2013 alone. West Virginia had about 122 complaints that claimed drilling was affecting well water over the last four years, with four of them linked to oil and gas drilling. It’s unknown what sort of pollution caused the complaints that were confirmed to have been due to fracking — it could have been chemicals from the fracking operation, which oil and gas companies aren’t federally obligated to release, or methane, which according to the AP is the more common form of fracking-related water pollution. The investigation sheds light on the hundreds of complaints made in these four states alleging contamination from drilling operations, and it adds to evidence that fracking can pollute well water. A July Pennsylvania study found the methane concentration of residential water wells at homes one mile from a fracking well was six times higher than it was in homes located farther away from wells, while levels of ethane, another natural gas component, were 23 times higher in homes closer to fracking wells. Fracking has been tied to other instances of water contamination as well — an October report found that in New Mexico, chemicals from fracking waste pits have contaminated water sources at least 421 times.
PA Gov Accused Of ‘Trying To Confuse The Public’ With Environmentally-Friendly Fracking Agreement (Updated) - On Monday, Corbett announced that he had entered into a voluntary agreement with Pennsylvania’s oil and gas drillers to comply with buffer zones under Act 13, which had required fracking operations, deep-shale drilling pads and conventional oil and gas wellbores to be at least 100 or 300 feet from environmentally sensitive areas, depending on the type of drilling. Those buffer zones — also called the “setback provisions” — were struck down in December when a state Supreme Court judge ruled them unconstitutional. The reason the buffer zones were ruled unconstitutional, however, was that drillers were not actually required to comply with them, according to Jordan B. Yeager, an attorney who represented plaintiffs in the case against Act 13. Because drillers were not required to comply, the law in essence meant that natural gas companies could drill anywhere they wanted, regardless of local zoning laws. “The provision had a mandatory waiver requirement. So as long as the drilling company said ‘we’ll take steps back to protect the waters,’ the Pennsylvania [Department of Environmental Protection] had to grant a waiver to the setbacks,” Yeager, who represents the Delaware Riverkeeper Network, told ClimateProgress on Tuesday. “Those setback provisions were completely illusory. That’s why it got struck down.” Act 13′s setback provisions were struck down in part because of Article 1, Section 27 of Pennsylvania’s state Constitution, which the gives the state “not just the authority, but the duty” to protect the state’s natural resources, Yeager said. In other words, the state has an obligation to protect waterways and wetlands from drilling, regardless of whether Act 13 is in place or not. Provisions under the state’s Clean Streams Law and the federal Clean Water Act also require the state to guard its waters from fracking operations and pollution.
After Trying ‘All Other Means,’ Protesters Are Now Super-Gluing Themselves To Fracking Sites -- It’s 2014, and three people in England have already super-glued themselves to various anchored items around hydraulic fracturing sites in acts of protest. According to a report from the Manchester Evening News, two anti-fracking protestors were arrested on Tuesday for protesting at the Barton Moss fracking site in Manchester. This was not a normal protest, however — the women reportedly parked their Blue Ford Escort in front of the site, cut a hole in the bottom of the car, placed a barrel full of concrete in the hole, and superglued themselves into the barrel. The women — arrested for willful obstruction of a public highway — knew they would be arrested for the stunt, fellow campaigner Mandy Roundhouse told the Evening News. “They have done letter-writing, they have done going on marches, they have tried all the other means and nothing is working so they have had to resort to this,” Roundhouse said. “It’s not a decision they have taken lightly.” It is not the first time anti-fracking protestors in England have gone to extreme measures to protest fracking, which is a method of extracting fossil fuels that generally increases the flow of oil or gas from a well. On Thursday, another anti-fracking protester super-glued herself to the gates of Barton Moss, causing delays for trucks that usually drive through to and from the site. The protests follow recent news in mid-December that two-thirds of the U.K.’s land will be available for fracking firms to license — a major fracking effort that the government reportedly hopes will result in hydraulic fracturing delivering about 25 percent of the U.K.’s annual gas needs.
Exclusive: Permit Shows Bakken Shale Oil in Casselton Train Explosion Contained High Levels of Volatile Chemicals - On January 2, the Pipeline and Hazardous Materials Safety Administration (PHMSA) issued a major safety alert, declaring oil obtained via hydraulic fracturing ("fracking") in the Bakken Shale may be more chemically explosive than the agency or industry previously admitted publicly. This alert came three days after the massive Casselton, ND explosion of a freight rail train owned by Warren Buffett's Burlington Northern Santa Fe (BNSF) and was the first time the U.S. Department of Transportation agency ever made such a statement about Bakken crude. In July 2013, another freight train carrying Bakken crude exploded in Lac-Mégantic, vaporizing and killing 47 people. Yet, an exclusive DeSmogBlog investigation reveals the company receiving that oil downstream from BNSF — Marquis Missouri Terminal LLC, incorporated in April 2012 by Marquis Energy — already admitted as much in a September 2012 permit application to the Missouri Department of Natural Resources (DNR). Rather than a normal permit, Marquis was given a "special conditions" permit because the Bakken oil it receives from BNSF contains high levels of volatile organic compounds (VOCs), the same threat PHMSA noted in its recent safety alert. Among the most crucial of the special conditions: Marquis must flare off the VOCs before barging the oil down the Mississippi River. (Flaring is already a highly controversial practice in the Bakken Shale region, where gas is flared off at rates comparable to Nigeria.) It's a tacit admission that the Bakken Shale oil aboard the exploded BNSF train in Casselton, ND is prone to such an eruption.
Buffett Looks at Pipelines after North Dakota Train Wreck: Amid fears that regulators may move to tighten safety rules for crude oil shipments from North Dakota after the fiery derailment last week of an oil train, Warren Buffett’s Berkshire Hathaway has announced plans to acquire the pipeline development unit of Philips 66. Berkshire Hathaway, the owner of the BNSF oil train that derailed last Monday, has reportedly made a deal to acquire the Phillips Specialty Products unit of Phillips 66, which develops polymers to maximize pipeline flow potential, in a $1.4 billion stock deal. Analysts at the Motley Fool have suggested that the acquisition is Buffett’s way of “tipping his hand as to where he and Berkshire Hathaway might go elephant hunting next.” The suggestion is that acquiring Phillips 66’s special unit is both an investment in oil and gas transport by pipeline and a longer bet on increased US domestic consumption. The fear is that the North Dakota derailment, which follows on the Quebec train disaster, will see a tightening of regulations on crude oil shipments from North Dakota, but this could also apply to pipelines, which have had their own disasters.
Why the U.S. Oil Boom may go off the Rails -- Lawmakers and U.S. regulators began asking questions about the safety of transporting oil on the nation's rail system following a December derailment in North Dakota. The Pipeline and Hazardous Materials Safety Administration issued a safety alert following the late December derailment of a BNSF line carrying oil from the Bakken reserve area in North Dakota. No injuries were reported in the 106-car accident near Casselton, though the derailment sparked an explosion and fires that burned for more than 24 hours. "PHMSA also advises emergency responders to be alert to the risks of crude oil transportation due to the increased volume of transportation and the wide range of crude oil properties," the agency said. The Association of American Railroads, which welcomed the PHMSA advisory, said 495 million barrels of petroleum and petroleum products were delivered on the U.S. rail system last year, a 31.1 percent increase from the previous year. The North Dakota Industrial Commission said more than 90 percent of the state's oil production comes from the Bakken and Three Forks areas. October's production level of 941,637 barrels of oil per day was a new all-time record, though there isn't enough pipeline capacity to keep up. Robert Harms, chairman of Republican party in North Dakota, said oil production in the state may be too much too soon and U.S. Sen. Charles Schumer, D-N.Y., said he wanted federal authorities to either overhaul, or eliminate, older rail cars involved in the BNSF derailment.
So-called DOT-111 rails cars were involved in a 2013 accident in Lac-Megantic, Quebec, which left more than 45 people dead after a train carrying Bakken oil slipped its tracks and exploded.
AGAIN! Canada crude oil and propane train still burning after derailment in New Brunswick - A train carrying crude oil and propane is still burning in the Canadian province of New Brunswick after partially derailing overnight. More than 100 residents of nearby Plaster Rock were evacuated from the village on Tuesday night after 15 cars and one locomotive derailed. Officials are using helicopters to determine the full extent of the fire. A derailment in Quebec last July killed 47 people, prompting concerns about the oil-by-rail business. Another train carrying crude oil exploded in late December in the US state of North Dakota. Officials said there had been no injuries or deaths in the latest derailment on Tuesday as it had taken place in a sparsely populated area 20 miles (32km) from the US border. But they were worried about secondary explosions. "The biggest concern is the propane cars," the Plaster Rock fire chief Tim Corbin told broadcaster CBC. "If they happen to explode, we're looking at major damage." Canadian railway officials said four of the cars that derailed were carrying propane and four others had crude oil. "At this point, we haven't determined to what extent each of those cars is involved,"
Former BP geologist: Peak oil is here and it will ‘break economies’ -- A former British Petroleum (BP) geologist has warned that the age of cheap oil is long gone, bringing with it the danger of “continuous recession” and increased risk of conflict and hunger. At a lecture on ‘Geohazards’ earlier this month as part of the postgraduate Natural Hazards for Insurers course at University College London (UCL), Dr. Richard G. Miller, who worked for BP from 1985 before retiring in 2008, said that official data from the International Energy Agency (IEA), US Energy Information Administration (EIA), International Monetary Fund (IMF), among other sources, showed that conventional oil had most likely peaked around 2008. Dr. Miller critiqued the official industry line that global reserves will last 53 years at current rates of consumption, pointing out that “peaking is the result of declining production rates, not declining reserves.” Despite new discoveries and increasing reliance on unconventional oil and gas, 37 countries are already post-peak, and global oil production is declining at about 4.1% per year, or 3.5 million barrels a day (b/d) per year: “We need new production equal to a new Saudi Arabia every 3 to 4 years to maintain and grow supply… New discoveries have not matched consumption since 1986. We are drawing down on our reserves, even though reserves are apparently climbing every year. Reserves are growing due to better technology in old fields, raising the amount we can recover – but production is still falling at 4.1% p.a. [per annum].”
Have the Obits for Peak Oil Come Too Soon? - Michael Klare - Among the big energy stories of 2013, “peak oil” — the once-popular notion that worldwide oil production would soon reach a maximum level and begin an irreversible decline — was thoroughly discredited. The explosive development of shale oil and other unconventional fuels in the United States helped put it in its grave. As the year went on, the eulogies came in fast and furious. “Today, it is probably safe to say we have slayed ‘peak oil’ once and for all, thanks to the combination of new shale oil and gas production techniques,” declared Rob Wile, an energy and economics reporter for Business Insider. Similar comments from energy experts were commonplace, prompting an R.I.P. headline at Time.com announcing, “Peak Oil is Dead.” Not so fast, though. Before obits for peak oil theory pile up too high, let’s take a careful look at these assertions. Fortunately, the International Energy Agency (IEA), the Paris-based research arm of the major industrialized powers, recently did just that — and the results were unexpected. While not exactly reinstalling peak oil on its throne, it did make clear that much of the talk of a perpetual gusher of American shale oil is greatly exaggerated. The exploitation of those shale reserves may delay the onset of peak oil for a year or so, the agency’s experts noted, but the long-term picture “has not changed much with the arrival of [shale oil].” The IEA’s take on this subject is especially noteworthy because its assertion only a year earlier that the U.S. would overtake Saudi Arabia as the world’s number one oil producer sparked the “peak oil is dead” deluge in the first place. The most recent edition of World Energy Outlook, published this past November, was a lot more circumspect. Yes, shale oil, tar sands, and other unconventional fuels will add to global supplies in the years ahead, and, yes, technology will help prolong the life of petroleum. Nonetheless, it’s easy to forget that we are also witnessing the wholesale depletion of the world’s existing oil fields and so all these increases in shale output must be balanced against declines in conventional production.
Forecast 2014 — Burning Down the House -- Kunstler - Life in the USA is like living in a broken-down, cob-jobbed, vermin-infested house that needs to be gutted, disinfected, and rebuilt — with the hope that it might come out of the restoration process retaining the better qualities of our heritage. Some of us are anxious to get on with the job, to expel all the rats, bats, bedbugs, roaches, and lice, tear out the stinking shag carpet and the moldy sheet-rock, rip off the crappy plastic siding, and start rebuilding along lines that are consistent with the demands of the future — namely, the reality of capital and material resource scarcity. But it has been apparent for a while that the current owners of the house would prefer to let it fall down, or burn down rather than renovate. Some of us now take that outcome for granted and are left to speculate on how it will play out. These issues were the subjects of my recent non-fiction books, The Long Emergency and Too Much Magic. They describe the conditions at the end of the cheap energy techno-industrial phase of history and they laid out a conjectural sequence of outcomes that might be stated in shorthand as collapse and re-set. I think the delay in the onset of epochal change can be explained pretty simply. As the peak oil story gained traction around 2005, and was followed (as predicted) by a financial crisis, the established order fought back for its survival, utilizing its remaining dwindling capital and the tremendous inertia of its own gigantic scale, to give the appearance of vitality at all costs. At the heart of the matter was (and continues to be) the relationship between energy and economic growth. Without increasing supplies of cheap energy, economic growth — as we have known it for a couple of centuries — does not happen anymore. At the center of the economic growth question is credit. Without continued growth, credit can’t be repaid, and new credit cannot be issued honestly — that is, with reasonable assurance of repayment — making it worthless. So, old debt goes bad and the new debt is generated knowing that it is worthless. To complicate matters, the new worthless debt is issued to pay the interest on the old debt, to maintain the pretense that it is not going badly.
Iraq Forces May Soon Start Attack to Recapture Fallujah - Iraqi security forces, militias or tribesmen may soon start an attack to retake Fallujah from al-Qaeda-linked militants after about 9,000 families fled the city, a government official said. “I believe that a final combat will take place soon,” Faleh al-Issawi, deputy head of the provincial council of Anbar, said by phone from Ramadi. “Fallujah city is totally controlled by militias and this extends to Garma,” a town about 15 kilometers (9 miles) away. The army will allow residents to flee the city before it starts an attack, an unidentified Iraqi official told Agence France-Presse. Special forces have started operations in the city and the army has surrounded Fallujah, AFP said. U.S. Secretary of State John Kerry said yesterday the U.S. won’t send troops to assist Iraq. The attacking forces may include Iraqi troops, tribesmen, or militias, al-Issawi said. Forty civilians have died and 186 were wounded in the fighting, he said, citing figures from hospitals in Ramadi and Fallujah.
Battle to Recapture Fallujah from Al Qaeda Forces Coming Up; War in Iraq a complete Failure; US is Biggest Threat to World Peace - The war in Iraq cost the lives of 4,489 Americans, with another 51,778 wounded. Hundreds of thousands of Iraqis were killed or injured. We wasted over a trillion dollars in the process. Why? To remove Saddam Hussein. Hussein was a brutal dictator, but at least under Hussein, religious freedom existed. It doesn't now. Chaldean Catholics are targeted and killed simply because they are Catholic.There were no Al Qaeda forces in Iraq either. Hussein, a secular dictator, had no use for them. Now, following the war Al Qaeda operates openly. They even control the town of Fallujah. Please consider Iraq Forces May Soon Start Attack to Recapture Fallujah. Iraqi security forces, militias or tribesmen may soon start an attack to retake the city of Fallujah from al-Qaeda-linked militants, a government official said. Forty civilians have died and 186 were wounded in the fighting, al-Issawi said, citing figures from hospitals in Ramadi and Fallujah. The attacking forces may include Iraqi troops, tribesmen, or militias, he said. It's absolutely no wonder a Gallup Poll shows the US is the Biggest Threat to World Peace. In their annual End of Year poll, researchers for WIN and Gallup International surveyed more than 66,000 people across 65 nations and found that 24 percent of all respondents answered that the United States “is the greatest threat to peace in the world today.” Pakistan and China fell significantly behind the United States on the poll, with 8 and 6 percent, respectively. Afghanistan, Iran, Israel and North Korea all tied for fourth place with 4 percent.
Iraq snubs Iran’s offer to help it fight al-Qaeda militants - Iraq has rejected an offer from Iran to help it fight al-Qaeda militants who are currently in control of a strategic town and parts of a provincial capital in the western parts of the country. “Iraq is not in need of Iran’s assistance and intervention in its fight against al-Qaeda,” said Mudher al-Janabi, a member of the parliamentary Commission on Defense and Security. Iran’s chief of staff, major-general Mohammed Hujazi. has said that Iran was ready to come to Iraq’s assistance in its battle against ISIS. ISIS is the al-Qaeda linked Islamic State of Iraq and the Levant and its active in both Syria and Iraq. Large numbers of its militants have attacked cities in Iraq’s western desert, which they have turned it into a major stronghold.
Al Qaeda Now Controls More Territory In The Arab World Than Ever Before -- In what can be described a truly ironic event and a major failure for America's stated mission (because one can't help but wonder at all the support various Al Qaeda cells have received from the US and/or CIA) of eradicating the Al Qaeda scourge from the face of the earth, we learn today that al Qaeda appears to control more territory in the Arab world than it has done at any time in its history. According to a CNN report "from around Aleppo in western Syria to small areas of Falluja in central Iraq, al Qaeda now controls territory that stretches more than 400 miles across the heart of the Middle East, according to English and Arab language news accounts as well as accounts on jihadist websites." The following recent map from Jane's shows just how extensive Al Qaeda's influence has grown in recent years.
China urges immediate end to conflict in South Sudan --China has called for an immediate end to hostilities in South Sudan, where the government is in talks with neighbouring Sudan to deploy a joint military force to protect vital oilfields from rebels. In a rare overt political intervention in Africa, the Chinese foreign minister, Wang Yi, said he was deeply concerned by the unrest in South Sudan, which has left more than 1,000 people dead and reduced oil flows by about a fifth. "China's position with regards to the current situation in South Sudan is very clear," Wang told reporters in Addis Ababa, Ethiopia, where direct talks aimed at a ceasefire finally got under way on Monday. "First, we call for an immediate cessation of hostilities and violence." China would do what it could to help restore stability in South Sudan and urged international powers to back the Ethiopian-led mediation efforts. An Ethiopian delegate told Reuters that Wang met both rebel and government delegations. China is Africa's single biggest trading partner, having overtaken the United States over the past decade, but professes to remain neutral and not interfere in African states' internal politics. It is the biggest investor in oilfields in South Sudan through state-owned Chinese oil groups China National Petroleum Corp (CNPC) and Sinopec. The fighting forced CNPC to evacuate workers.
China’s Appetite for Resources Sharpens - China’s appetite for a number of imported resources broke records in December despite signs of an economic slowdown for the month. Analysts expect China’s appetite for the world’s inputs will continue to grow into the new year – though the market for iron ore is showing signs of softness. The most notable preliminary data released by Chinese customs officials on Friday was China’s imports of crude oil, which rose to a high of 26.78 million metric tons, or 6.33 million barrels a day. Last year was chock full of records for China’s crude imports, with December’s shipments surpassing both a high set in July for absolute volumes and a high set in September for a daily average.The country’s crude imports in December rose 13.1% from the corresponding month a year earlier and were up 13.7% from November’s shipments, according to Wall Street Journal calculations. Analysts said Chinese refiners were expected to process more crude in December to meet increased demand for transportation during winter and on expectation of a busy driving season over the Lunar New Year holiday, which begins in late January. “Sometimes [importers] want to strike a note at the end of the year,” said Kang Wu, vice chairman of Asia for energy consulting firm FGE. Mr. Wu said that he expected China’s crude imports in 2014 to be “slightly better” than in 2013 due to an expected pick up in China’s economy. Although December’s imports rose to a record high, China’s crude imports for the year rose 4% for the year compared with 2012, slowing from 6.8% growth in 2012 from the year before that.
In The Face Of Historic Smog, China Adds $10 Billion In New Coal Production Capacity -- Despite experiencing the worst air pollution on record in 2013, China last year approved the construction of more than 100 million tonnes of new coal production capacity at a cost of $9.8 billion, according to a report compiled Wednesday by Reuters. The increase in coal production in 2013 was six times bigger than the increase in 2012, when the administration approved just four coal projects with 16.6 million tonnes of annual capacity and a total investment of $1.2 billion. In other words, in just one year, China added coal production capacity equal to 10 percent of total U.S. annual usage. The news is startling, considering the country’s world famous pollution, which has caused myriad health problems, marred cityscapes, and even gave an 8-year-old girl lung cancer. What’s more, the pollution has recently been confirmed to be caused by fossil fuel production, with coal at the forefront. The news of China’s staggering increase in coal production capacity also casts serious doubt on the government’s recently-announced new pollution reduction targets, which reportedly require all of China’s provinces to reduce air pollution by 5 to 25 percent annually. If China continues its ravenous appetite for coal in 2014 the way it did in 2013, it is very difficult to see how those goals will be met. Coal supplies 26.6 percent of energy use worldwide and claims responsibility for 43.1 percent of global CO2 emissions, according to data from the Center for Climate and Energy Solutions.
China Services PMI Crumbles To 2nd Worst Level On Record - Following the missed expectations of the Manufacturing PMIs in China, it appears 'reform' is having the exact slow-growth-inducing credit-creation-dampening effects many had worried about (but dismissed because - well the Fed has out back right?). HSBC's China Services PMI slumped by its most in 8 months to its lowest level since August 2011 (the 2nd worst level since the data began). New business expansion in particular dropped to its lowest level in 6 months and while labor market conditions improved marginally, HSBC - desperate to cling to some silver lining - noted the Composite PMI remains above 50 (phew) - adding "we expect the steady expansion of manufacturing sectors to lend support to service sector growth..." or not. Markets are disappointed... This is also the slowest 'expansion' of Services relative to Manufacturing since April 2011
People’s Bank of China — 2014 Outlook - Mr. Zhou regularly remarks that he wants to make China’s financial system more market-based. That means putting in place bank deposit insurance, letting bank deposit rates and China’s exchange rates rise and fall with the market, and making it easier for money to flow in and out of China. The changes also would help China develop as a consumer-based economy, a goal China’s leaders have long espoused. “There is a huge middle-income group and they need imported clothing, laptops and cosmetics,” said Mr. Zhou’s number two, Yi Gang, in a December interview with the Chinese magazine Caixin. In the Caixin interview, Mr. Yi tried to explain why a stronger yuan would help China. He acknowledged the power of China’s export lobby to block appreciation of the country’s currency. “Export companies speak with loud voices,” he said. Each of the major changes sought by the PBOC is opposed by powerful factions, especially massive state-owned banks, which have profited enormously from the current system. Now, the government implicitly guarantees their health and explicitly makes it easy for the banks to profit by keeping deposit rates low and regulated. On defense, the PBOC must decide how to slow China’s escalating debt, which has grown so rapidly over the past five years that it reminds Chinese and foreign economists alike of the credit bubbles that eventually burst in the U.S., Europe and other parts of Asia. First, the PBOC must decide what to do. Boost interest rates? More tightly regulate so-called shadow lenders, such as trust companies and informal lenders, which work out complicated deals with the banks to hide risky loans? Whatever the PBOC decides, it must then sell to the top decision makers in the government and Communist Party. Unlike the Fed and other major central banks, the PBOC isn’t independent. It’s essentially an advisory body.
Few Specifics Mean China Banks Could Stay in the Shadows - China sent its clearest signal so far about how it wants to handle its growing debt problem: very carefully. The government’s top decision-making body, the State Council, drafted a framework for regulation that recognizes that the growth of loans from shadow banking institutions has become a growing problem and tried to parse out responsibility for dealing with the issue to the country’s central bank and financial regulators. In the stilted language of government, the State Council demanded that detailed regulation of different kinds of shadow-lending activities be carried out “one by one,” and proper internal controls and risk-management systems be set up by “relevant institutions.” But equally important was what the State Council didn’t say: It made no mention of trying to sharply ratchet down China’s debt which since 2008, has grown to 216% of GDP from 128% and could climb to 271% by 2017 if not corrected, according to Fitch Ratings. Indeed, the framework regulation goes out of its way to call shadow banking is an “inevitable” result of financial innovation and has played an “active” role in serving the economy and broadening the investment channels for Chinese individuals. It left out the specifics of what to do to China’s regulators, who will fight it out among themselves and with lenders and local governments, which have found the status quo profitable. Why the on-the-one-hand, on-the-other-hand approach?
China’s Shadow Banking Problem - China’s top officials appear to be moving to address the risks posed by a fast-growing-but-shadowy part of the country’s financial system. The Chinese cabinet is seeking to increase government oversight of lending by companies that currently face little or no supervision, according to news reports based on an official document that was written last month. Economists have long worried about China’s so-called shadow banking system, in which banks and finance companies loan money to businesses and local governments at high interest rates outside the regulated financial system. Analysts worry that unregulated lenders, which themselves borrow money from regulated banks, have made too many dubious loans that could default and set off a broader financial crisis. In recent months, interest rates in China have surged from time to time in part because of the links between the unregulated and regulated parts of the financial system. The shadow system has grown in recent years because the Chinese government has too tightly controlled traditional banking. It keeps the interest rates that conventional banks pay to depositors extremely low and gives out cheap loans to state-owned enterprises and favored companies that might not be able to repay the money. The low rates, of course, have led savers to invest money in speculative real estate projects or dubious investments known as wealth management products offered by banks and finance companies that promise higher rates of return. Much of that money is then lent to private businesses and local governments, which cannot get conventional bank loans because regulated banks are required to give preferences to state-owned companies.
Early Look: China Set to Beat Growth Target by a Whisker - China likely exceeded its 2013 growth target by a whisker, economists said, though it looks all but certain that the economy slowed down at the end of the year. Gross domestic product probably rose by 7.6% year-over-year in the final quarter of 2013, down from 7.8% in the third, according to the median forecast of 13 economists surveyed by The Wall Street Journal. That would mean about 7.6% growth for the whole year as well—just ahead of the 7.5% target. The GDP numbers, along with other major data like industrial production and fixed-asset investment, are set to be released Jan. 20. A slew of data suggest a broad-based slowdown in December. The government’s manufacturing and non-manufacturing purchasing managers’ indexes both fell, as did the two competing measures published by HSBC Holdings. It is the first time all four readings have fallen together since April. The growth of industrial production likely slowed to 9.8% year-over-year in December from 10% in November, according to the Journal’s survey. Fixed-asset investment growth likely came in at 19.8% for the year as a whole, down from with 19.9% in the January-to-November period, as firms turned cautious and cut down on investment. A big part of the slowdown stems from an easing of the impact of a massive burst of lending in early 2013, as economic growth slowed. With a net 5.1 trillion yuan ($840 billion) of bank loans extended in the first half of 2013, and trillions more in bonds and off-balance-sheet lending, it was natural that there would be a few months of strong growth. But banks probably made just 590 billion yuan of loans in December, the economists in the survey said, making it the second-slowest month of the year in terms of lending. That would bring total loans in the second half of the year to just short of 4 trillion yuan, and may spell a slowdown ahead.
George Soros warns that Chinese slowdown is biggest worry in 2014 - George Soros is worried about China, and we should take note. The hedge fund boss, who built his fortune betting on the world's money markets, is concerned that 20 years of rapid growth is about to run out of steam. Soros, who famously bet against the strength of the pound in the European exchange rate mechanism and won during 1992's Black Wednesday debacle, will be a prominent figure at the World Economic Forum in Davos later this month, when policymakers and business people debate how to foster global growth. In the Square Mile, a brief glance at the stock market shows the impact of a slowdown in Chinese manufacturing output last month – and the fear that this will become protracted. The FTSE 100 is down 30 points since the new year break. It includes mining companies such as Rio Tinto and Anglo American, which have strong links to the Chinese economy. Signs that the world's second-largest economy is slowing have caused the price of many commodities to fall, and helped break a 12-year bull run for the gold price. (China consumes around half of the world's iron ore and coal, and buys more than a third of its base metals.) Beijing's move to cut back on corn imports made the grain the worst-performing commodity last year, as it fell almost 40%.
How Serious is China’s Shadow Banking/Wealth Management Products Problem? - Yves Smith - George Soros has caused a bit of a frisson by calling China the greatest risk to the global economy. In a Project Syndicate article, the famed hedge fund manager stressed that China has been able to use its control over credit to heat up and cool off its economy. The government tried cutting lending back in 2012, but when the credit squeeze become painful, the officialdom eased in mid-2013 and the expansion resumed. Soros’ concern is that debt levels have hit the point where an end-game is nigh; he believes the Chinese have only a couple of years of current levels of debt expansion at their disposal before the side effects become too damaging. But why the dour view? Many argue that the government controls the banks, and the Chinese command economy model has outdone the West, so critics are barking up the wrong tree. But the picture has changed radically in the last few years. Even as of 2008, the productivity of more debt was falling. It was taking $4-$5 of new borrowing to generate $1 in GDP growth. That was comparable to the level of debt productivity on the eve of the crisis in the US. The big source of worry isn’t just the level of debt but its structure, meaning the explosion of the shadow banking system. Bloomberg gives a good overview, in Shadow Banking Risks Exposed by Local Debt Audit. It’s important to keep in mind that bulk of government spending takes place at the local level, which accounts for 80% of expenditures even though it collects only 40% of total tax revenues. China’s audit of local governments exposed an increased reliance on shadow banking, swelling the risk of default on 17.9 trillion yuan ($3 trillion) of debt. Bank lending dropped to 57% of direct and contingent liabilities as of June 30 from 79% at the end of 2010, while bonds rose to 10% from 7%, National Audit Office data show. Trust financing surged to 8% from zero, while other channels that sidestep loan curbs accounted for the remaining 25%. The yield on five-year AA notes, the most common rating for local government financing vehicles, jumped by a record 158 basis points last year to 7.6%. That exceeds the 5% on emerging-market corporate notes, Bank of America Merrill Lynch indexes show.
Is China About to Let the Yuan Rise? Don’t Bank on It - China’s central bankers are beginning to think the country’s huge pile of reserves – which is still growing as authorities intervene to keep the yuan from rising too fast– is excessive. Curbing its growth could even help the economy’s transition from an export-led model to one based on domestic consumption. But the top leadership’s fear of social unrest means things are unlikely to change soon. In the wake of Asia’s 1997 financial crisis, central banks around the region decided it would be wise to build up their reserves of foreign exchange. The sudden outflows of capital from emerging markets last year, when the U.S. Federal Reserve first floated the idea of slowing down its asset purchases, showed how quickly things can turn. Indonesia’s forex reserves declined by $14 billion between April and August last year as the country’s central bank spent big to shore up the rupiah. China – whose capital controls kept it largely insulated from the taper selloff — has the opposite problem. In an effort to hold down the value of its currency and keep Chinese exports competitive, the PBOC wades into markets, buying up foreign exchange and pumping out yuan on a massive scale. The PBOC probably bought $73 billion dollars of foreign exchange in October, the most in three years, and a similar amount in November, Even before that, official figures showed China’s reserves had hit a record $3.66 trillion by the end of the third quarter, the bulk of it invested in U.S. dollar securities like Treasury bonds. Sitting on $4 trillion might not seem like a bad position to be in, but it can make a mess of domestic monetary policy if those reserves result from the central bank’s attempts to deal with capital inflows. Interest rates in China already are significantly higher than in many other countries, making it a tempting target for speculative “hot money” flows, which tend to find a way in despite the country’s capital controls.
China Data Suggest Tepid Pickup in West - China's export growth weakened in December, casting doubt on a hoped-for recovery in demand from the U.S. and Europe. Exports in December were up just 4.3% compared with the same month a year earlier, down from a much stronger 12.7% year-over-year rise in November, according to customs data released on Friday. China's traditionally important export sector faces a range of challenges, from higher labor and land costs to an appreciating currency that eats into its competitiveness..As the U.S. and Europe regain economic momentum, experts expect China to benefit from better export demand. But the slow pace of improvement in December was a letdown for many. "The lift from developed markets has not been as strong as expected," "This year might be a better year [for exporters], but the pace of improvement could be very modest." The poor export growth may in part be due to more than trade flows. China's State Administration of Foreign Exchange said in December it was tightening supervision of trade financing to stop speculative "hot money" flows from being disguised as trade. That likely dragged down an already weak growth number, Ms. Sun said Friday. Official data showed a jump in December 2012 that many economists attributed to capital flows misreported as trade. By contrast, the latest import figures were strong, beating forecasts with an 8.3% year-over-year rise in December, up from 5.3% in November. They were boosted by high raw-material shipments. China brought in 6.33 million barrels a day of crude oil in December, a record, and copper, iron ore and plastic imports were up strongly, too. That could indicate that companies are building up inventories again after running them down earlier in the year
China overtakes US as world’s largest goods trader - FT.com: China became the world’s biggest trader in goods for the first time last year, overtaking the US for all of 2013 and finishing the year with record trade figures in December. Coming fast on the heels of China taking over as the world’s largest oil importer, the shift is another milestone as the country takes its place among the world’s most powerful nations. Trade with the rest of Asia and increasing flows with the Middle East represent a shift in power away from the US, still the world’s largest economy. The total value of China’s imports and exports in 2013 was $4.16tn, a 7.6 per cent increase from a year earlier on a renminbi-adjusted basis, according to figures released by the Chinese government on Friday. The US will release its full-year figures in February but its total imports and exports of goods amounted to $3.57tn in the 11 months from January to November 2013, making it a virtual certainty that China is now the world’s biggest goods trading nation.
China's Economy Could Be Bigger than America's - In coming years, we’ll hear a lot about the size of China’s economy surpassing that of the United States. The latest prediction is out from the Centre for Economics and Business Research, which says that the Chinese economy will grow larger than America’s in 2028. This is actually much later than some forecasts predict. The OECD for instance argues that China’s economy will be bigger than America’s by 2016. And other economists like Peterson Institute for International Economics’ Arvind Subramanian predict that China’s economy is already bigger than the United States’. How can these estimates be so far apart? The main reason is that it’s difficult to compare different country’s economies when they use different currencies and when the citizens of those countries have much different purchasing power. For instance, 1 U.S. dollar is worth 6.05 yuan. So a simplistic way of comparing U.S. and Chinese GDP would be to divide Chinese GDP in Yuan by 6.05. But in reality, prices in the U.S. are somewhat higher than those in China, so 6.05 in Yuan isn’t going to buy the same amount of goods in the U.S. as it would in China. This is why economists try to estimate exchange rates adjusted for purchasing power. And it’s through this process of estimating differences in purchasing power that you get such different estimates of GDP. The upshot is that the Chinese economy could already be bigger than our own.
For Japanese, Deflation Fears Linger Despite Rising Prices --To end years of deflation, Japan needs to convince people that wages will increase as the economy recovers. But the latest data from the Bank of Japan shows people remain unconvinced about their earning potential and the country’s economic prospects for 2014, despite a recent upturn. The BOJ’s quarterly survey, released Thursday, is likely to temper optimism that Japan is close to a recovery that will end years of falling prices. One-fifth of more than 2,000 people surveyed by the BOJ said they felt Japan’s economy worsened in the three months to December compared to a year earlier. The proportion was up from 20.6% in the previous September survey. Those saying the economy was unchanged stood at 65.9% from 66.9%. Almost 30% of respondents said they expected the economy to worsen in 2014, compared with 25.8% in the previous survey. On wages, Japanese respondents appeared equally pessimistic. The survey showed that 37.8% of people said they expect incomes to decrease over the coming year, up from 36.0% in the previous poll. Only 8.1% expected a rise in incomes, down from 8.3% previously. These figures are bad news for Prime Minister Shinzo Abe, who has promised to end deflation. A massive monetary stimulus in place since April has helped weaken the yen and push up share prices. Japan’s economy is growing at almost 3% annually, among the fastest in the developed world. Exports have begun to recover and inflation hit a five-year high in November.Many regular Japanese, though, say they are yet to see the benefits of these developments. Wages have not risen, while higher prices are increasing household bills.
Japanese Keep Holding Cash, Despite New Technology - In Japan, you can use your credit card as a commuter pass to get on trains. You can buy canned drinks by swiping your cell phone across a vending-machine data pad. At first glance, it seems the cashless society has arrived. But the reality is that demand for cash keeps growing — a trend that confounds economists, and even the central bank. Japanese Y10,000 notes arranged for a photograph in Tokyo on Dec. 13, 2013.—Bloomberg NewsAt the end of 2013, the total amount of currency in circulation rose to Y90 trillion ($860 billion), partially because of year-end holiday demand. That is up 17% over the last decade, and the highest of any major industrialized nation when compared with the size of the economy. In the U.S., Federal Reserve figures show the amount of cash in circulation amounts to $2,029 per person after accounting for banknotes held outside the U.S. or by domestic banks. That compares to more than $6,000 per person in Japan. The demand for bills in Japan has actually picked up over the past three years, a phenomenon one central bank official called “mysterious.” As a proportion of nominal GDP, banknotes in circulation held mostly steady just below 10% until the mid-1990s, according to the Bank for International Settlements. It then rose to 19% by the end of 2012, more than twice the level of any other developed economy. This wouldn’t be an issue if people were spending all that cash. Yet economists say much of it is socked away at home in dressing cabinets and shoe boxes. That could be undermining Prime Minister Shinzo Abe’s goal of ending years of deflation, which has depressed wages and growth.
Government Stimulus Lifts Japan - Nearly a quarter-century after the Japanese stock market bubble burst at the end of 1989, the stock market leapt by more than 50 percent in 2013, as the era of deflation appeared to be finally ending. Final figures are not in, but it appears the economy grew faster in 2013 than in any year since 1996.As the accompanying charts show, however, much of the stimulus for the economy has come from the government, rather than the private sector, as Prime Minister Shinzo Abe, who took office just over a year ago, moved aggressively to apply fiscal stimulus and the central bank, the Bank of Japan, began a program of large purchases of Japanese government bonds. The government’s policies, known as “Abenomics,” are also supposed to include what the prime minister called a “third arrow” of economic reforms, but they have progressed much more slowly than the first two arrows of fiscal and monetary stimulus. In addition, it is unclear how much of the recent economic growth came from an acceleration of consumer spending in anticipation of an increase in the consumption tax scheduled for April.
Reserve Bank of India — 2014 Outlook - Raghuram Rajan’s big challenge in 2014 will be building on the gains he’s scored since taking the helm of India’s central bank last fall. The rupee was among the world’s worst-performing currencies in the summer, losing more than 20% of its value against the U.S. dollar between May and August, reflecting a rush of capital out of emerging markets. India, which runs large trade and budget deficits, depends on foreign capital to meet its financing needs. When foreign investors sensed U.S. rates were heading higher, they moved out of Indian stocks and bonds. Mr. Rajan managed to stabilize the currency and buy time by taking innovative steps to attract capital back to India. A program to attract deposits from non-resident Indians, for instance, raised $34 billion in foreign exchange reserves, far more than analysts had expected. He also took the tough decision of raising interest rates at a time when economic growth was already slowing sharply. The rupee is now trading close to 60 per U.S. dollar, up from lows just short of 69 in August. But many analysts say India could face new headwinds now that the U.S. Federal Reserve is winding down its $85 billion in monthly bond purchases, pushing U.S. interest rates higher. Mr. Rajan told reporters in mid-December that India is better prepared now than in the summer to weather the Fed’s moves, though there could be some volatility in the local markets.
India Minister Warns Of "The Return Of The Ugly American" - Nearly a month after American authorities arrested India’s deputy consul general in New York, Devyani Khobragade, outside her children’s school and charged her with paying her Indian domestic worker a salary below the minimum wage, bilateral relations remain tense. India’s government has reacted with fury to the mistreatment of an official enjoying diplomatic immunity, and public indignation has been widespread and nearly unanimous. So, has an era of steadily improving ties between the two countries come to an end?Judging from Indian leaders’ statements, it would certainly seem so. India’s mild-mannered Prime Minister Manmohan Singh declared that Khobragade’s treatment was “deplorable.” National Security Adviser Shivshankar Menon called her arrest “despicable” and “barbaric,” and Foreign Minister Salman Khurshid refused to take a conciliatory phone call from US Secretary of State John Kerry. Emotions have run high in India’s Parliament and on television talk shows as well. Writing to her diplomatic colleagues after her arrest, Khobragade, who has denied the charges against her, noted that she “broke down many times,” owing to “the indignities of repeated handcuffing, stripping, and cavity searches, swabbing,” and to being held “with common criminals and drug addicts.” A former Indian foreign minister, Yashwant Sinha, has publicly called for retaliation against gay American diplomats in India, whose sexual orientation and domestic arrangements are now illegal after a recent Supreme Court ruling. The government has not taken him seriously, but his suggestion indicates how inflamed passions have become.
How Financial Repression Protects India From Capital Flight -- Markets remain worried that India will experience more capital flight this year, after 2013 seems likely to be remembered in India as the year of taper fear and rupee roil. But a new Moody’s report highlights one factor working in India’s favor: The government doesn’t rely too much on foreign investors to finance its borrowing. Less than 10% of India’s sovereign debt was held by nonresidents last year—a larger share than in Brazil, but far smaller than in Indonesia, where nearly 60% of debt is owed to foreigners, according to the report. The Indian government’s borrowing is also overwhelmingly in rupees: Less than 10% is in foreign currencies, compared to around 40% in Indonesia and the Philippines. That means another round of volatility in capital flows and exchange rates isn’t likely to jeopardize Delhi’s credit rating and send government borrowing costs soaring. Moody’s also notes that Indian sovereign bonds have relatively long maturities, which means the government doesn’t have to repay or refinance so much of its debt each year. Even though India’s budget deficit is markedly higher as a share of gross domestic product than many of its peers’, Moody’s shows, its gross financing requirement for 2014 is smaller. The report doesn’t address the risks from Indian companies’ external borrowing, which could slam their bottom lines if interest rates rise sharply. But government borrowing, at least, is probably safe. That says a lot about the nature of India’s financial system, which has a lot more in common with China’s than most people probably realize. Capital controls prevent Indian residents and companies from easily keeping their savings overseas, where they might earn higher returns. This ensures that Indian banks have a large deposit base with which to make loans—including to the government, which mandates that commercial banks hold almost one-quarter of their basic deposits in the form of sovereign bonds and other approved securities.
A study of Financial Repression, part 4… Ultimately Unstable -- From part 3, financial repression expresses in positive ways. Examples, relative government debt is reduced, economic growth speeds up and exports become more competitive. Then why do most advanced countries steer away from it? Or at least why did they in the past? …Financial repression weakens domestic demand. Ultimately this is socially unstable, especially for a country like the United States. There is even concern of unrest in China. Financial repression increases production beyond domestic consumption. So then, who buys the extra production? There needs to be healthy foreign demand somewhere. Normally emerging economies find the extra demand from advanced countries with more purchasing power. So as long as the advanced countries stay stable economically, the financial repression in the emerging economies flourishes. But like the old saying, “When the United States sneezes, the world catches cold.” Recessions in advanced countries have a strong impact on emerging economies with financial repression. In the case of China, they depend on foreign demand, because domestic demand is so weak. China faced a big problem during the crisis when demand collapsed in Europe and the United States. What did China do to avoid its own economic collapse? It ramped up investment with easy credit flowing at low costs. Their economy kept growing.
For Asia, 2014 Looks Like a Year of Higher Interest Rates - For much of 2013, India and Indonesia were outliers in Asia, raising interest rates and tightening policy. This year, the rest of the region is expected to join them. “As the Fed has signaled the start of a long journey back to normalization, it would be prudent for a number of Asian central banks to get in front of that and start tightening in the second half of 2014,” The first hints last May that the U.S. Federal Reserve would begin cutting its economic stimulus sent emerging-market currencies and assets plunging, a severe blow to countries like India and Indonesia that are struggling with high inflation and that depend on foreign money to cover large current-account deficits. Indonesia’s central bank has raised rates by 1.75 percentage points since the spring, and some economists expect it to do so again at its meeting Thursday. For Asian economies with lower inflation and less need for external financing, the situation is different: There, raising interest rates would signal a return to more customary levels after an extended period of easing. Tighter policy could mean slower growth in Asia this year, but it could be necessary to get ahead of price pressures that are expected to begin rising again. Data Tuesday from the Philippines, for example, showed consumer inflation at a two-year high of 4.1% in December. Bangko Sentral ng Pilipinas should start tightening policy late in the second quarter or early in the third, before inflationary expectations become entrenched.
Transition, torpor and deflation - The Asian growth engine, which managed to keep world growth at acceptable levels throughout the current crisis, will become the world’s primary weak spot in 2014. And as emerging Asia falters, Europe will be hit by the fallout from the troubles of its best growth market for exports. This is not necessarily a bad thing for Asia, which actually needs to slow down and reconsider its economic model. The key metric for understanding the coming paradigm shift in emerging Asia is investment as a percentage of GDP. This measure shows how much new capacity and production is being added to an economy. In a balanced economy during normal business cycles, investment as a percentage of GDP should track overall GDP growth. But this is not a balanced global economy. In developed markets, the investment-to-GDP ratio has fallen and is now slowly trying to return to normal levels. No surprise there. Emerging Asia, however, shows a significant rise in investment from 2008, when real GDP growth was 10 percent and investment to GDP was 37 percent. Fast-forward to today and investment is now a staggering 43 percent of GDP in emerging Asia and growth is down to barely 6 percent. In the same period, developed markets have inched back to an investment rate of 19 to 20 percent of GDP from a trough of 15 percent in 2008 and a longer-term average of 23 to 24 percent.
Asia’s Domestic Demand Means Less Focus on Exports - Why has Asia continued to record strong economic growth in recent years, despite the West’s struggles? Partly it’s because more Asian trade is remaining within Asia. But it’s also because for many Asian economies, exports simply are less important than they used to be. The chart shows that for Asia excluding Japan, exports as a percentage of gross domestic product declined to 42.6% in 2011-2012 from 47.1% five years earlier. Of course, the picture is not uniform. In a few countries exports have continued to grow as a share of GDP: Vietnam and India stand out as success stories, with their export sectors blooming as competitiveness has improved. Elsewhere, as in South Korea and Taiwan, it’s more a reflection of weak domestic demand – export share there is ”going up for the wrong reasons, if you will,” says Frederic Neumann, co-head of Asian economics for HSBC. Generally, though, the trend in Asia is toward economies that rely more on domestic demand and less on the West. In China, this is part of a deliberate policy choice to emphasize consumption as a growth driver. In Malaysia, Indonesia and the Philippines, the falling export share reflects the emergence of a strong and vibrant consumer class.
Malaysia’s Trade Balance Improves, Just in Time for Fed Taper - Malaysia’s largest trade surplus in 20 months suggests the country can keep its current account in the black, a key advantage as the U.S. Federal Reserve begins winding down its bond-buying program. Hints last spring that the Fed was preparing to taper its economic stimulus sparked an exodus from emerging markets as investors began to expect higher returns back home. That shined a spotlight on Asia’s economic fundamentals, with countries sporting deficits in their fiscal and current accounts bearing the brunt of the selloff. Malaysian assets were among those punished as the country’s current account came perilously close to deficit in the middle of 2013. The ringgit tumbled 2.8% against the U.S. dollar and foreign ownership of Malaysian government bonds fell to 42.8% at end-September, from 46.8% three months earlier. Bank Negara Malaysia largely stayed on the sidelines during the selloff, as the weaker currency made the country’s exports cheaper while dampening import demand. Meanwhile, the government enacted a serious reform program, cut subsidies to improve its fiscal outlook and took emergency measures — such as staggering capital-intensive imports — that kept the current account barely in surplus. Several months later, Wednesday’s data showed the trade surplus widened in November to MYR9.72 billion (US$2.96 billion) from October’s MYR8.23 billion. The trade balance is a major component of the current account.
Baltic Dry Index Collapses 35% - Worst Start To Year In 30 Years - When this indicator of global trade rises, everything is rosy and reams of asset-gatherers and talking-heads wil quote it as indicative of how great the world is. When it drops - silence. There's always an excuse - over- or under-capacity, too many ships, too few ships, etc. However, the last 2 weeks have seen a 35% collapse in the cost to ship bulk. There is a relative seasonal pattern over the holiday period - with shipping costs rising into the holiday and falling after but... this is the biggest drop from a Christmas Eve since at least 1984, 30 years! Seems like the inventory stacking of Q4 had absolutely no follow-through whatsoever...All thepost-Thanksgiving exuberance has been eviscerated from the Baltic Dry Index...
Administration Peddling Increasing Blatant Misdirection on Proposed “Trade” Deals - Yves Smith --We’ve both written and spoken about the wildly mislabeled “trade” deals that the Obama Administration is still trying hard to conclude, despite its abject failure to meet an arbitrary deadline of year end 2013. The two pending deals, the Trans-Pacific Partnership and the Trans-Atlantic Trade and Investment Partnership, have perilous little to do with trade. But invoking the magic incantation “free trade” seems to neutralize the reasoning ability of economists and the media. In a sign that the Financial Times is gaining more influence in the US, a piece about these that was on the front page last night looks to be a clear media plant. The pink paper is dutifully falling in with the official line. One of the tricks of dealmaking and legislating is to try to create the impression that the negotiations/vote herding are going well, even when they aren’t. That tactic was fully on display with the Administration’s failed effort to get Congressional approval for intervention in Syria. The White House kept messaging that it was getting support lined up even when whip counts showed that putting the measure to a vote would result in an overwhelming rejection. In the article, Obama challenge on selling trade deals to resurgent left, there is astonishingly no mention of the issues the prospective partners have with the deal or how the Wikileaks publication showed that the critics if anything had understated how bad the deal is. And the headline pretty accurately reflects the spin of the article: Obama’s is supposedly those damned pinkos, as opposed to his lame duck status and the increasingly obvious outrageousness of the deal. But to an uninformed reader, it’s easy to sell the prejudice that only Luddite lefties are against the motherhood and apple pie of economists and the business community, “free trade”.
Obama Lame Duck Watch: House Democrats Stymieing Trade Deal “Fast Track;” Silicon Valley Surveillance Payoff Language Published - Yves Smith -- As we discussed earlier, even though there’s abundant evidence that the Administration’s plans to push through its trade deals, the Trans Pacific Partnership and the Transstlantic Trade and Investment Partnership, are in trouble, the official messaging has been to keep pretending that the pacts are still moving forward smartly. We aren’t there yet on these misnamed trade deals, but we are getting mighty close (as we’ve recounted at length in previous posts, as well as on Bill Moyers with Dean Baker, these pacts have perilous little to do with trade, they are really about enriching Hollywood, Silicon Valley, Big Pharma, financial services firms, and multinationals, while crippling the ability to impose regulations of all sorts, including wage protections). Based on the known opposition of some potential signatories to important provisions (for instance, Malaysia and Chile opposed restrictions on capital controls), there was no way agreement could be reached in the remaining sessions. After this chat with the press, a Wikikeaks release of a markup of an important chapter, that on intellectual property, showed how virtually all of the substantive provisions were contested by many, in some cases almost all, of the US’s supposed “partners” in this agreement. Just as the the foreign negotiators are digging in their heels over the Administration’s overreaching and bullying, quite a few Congressmen fail to see why they should throw their constituents under the bus to help Obama get funding for his presidential library. Huffington Post tells us that the Administration’s efforts to get so-called fast track authority, which the negotiators claim is critical to getting a deal done, looks to be going pear-shaped in the House. While we’ve written previously about significant opposition (both Democrats and Republicans had circulated letters against the bills and gotten an impressive amount of support, but not enough to give the opponents a clear majority), it is looking as if the nays might carry the day:
Fast Track Legislation: Dead On Arrival? - Fast track legislation is moving forward. Retiring Senator Max Baucus(D-MT) and Republican leaders introduced a bill to give trade promotion negotiating authority (a.k.a. “fast track” authority) to complete the proposed Trans-Pacific Partnership and a trade and investment deal (the TTIP) with the European Union. The sponsors were unable to obtain a Democratic co-sponsor in the House, and House Ways and Means Ranking Member Sander Levin introduced a strong statement calling for a better model for negotiating trade agreements. Fast Track is a terrible idea because it’s a proven job killer. It gives the president the right to send treaty implementing legislation to Congress for a vote without any opportunity to amend or improve it. Setting enforceable job creation goals or creating effective mechanisms to deal with currency manipulation, for example, will be impossible if the legislation is fast-tracked. NAFTA, which was fast-tracked in 1993, and which was the prototype for more than a dozen U.S. trade and investment deals negotiated over the past decade, resulted in growing trade deficits with Mexico that eliminated nearly 700,000 U.S. jobs by 2010. Fast track legislation in its current form is opposed by more than 170 Republican and Democratic House members, so this legislation might be dead on arrival. The House Republican leadership is reportedly insisting that at least 50 Democrats co-sponsor the legislation, including at least one House Democratic leader, before it will be allowed to come to a vote on the House floor. With luck, the fast track bill will die in the House.
Trade Bill Touches on Hot Topic: Data Flow - Fast-track trade legislation unveiled Thursday includes strong language backing the free flow of data internationally, an area that’s generated increased tension with Europe since the disclosures of former NSA contractor Edward Snowden. Big companies say they need to be able to zip customer data around the world to avoid unnecessary costs and inefficiencies, and they’re seeking to protect such data flows through international trade agreements. In theory, international rules for corporate data use have little to do with government surveillance, leaks and the individual right to privacy. But Mr. Snowden and the recent National Security Agency scandal shifted public awareness and perceptions on the issue, blurring the lines separating corporate data, government spying and privacy rights. A top EU official warned in a recent speech in Washington that the issue could derail nascent negotiations on forming a trade bloc. Europeans were among the loudest critics of U.S. policy after Mr. Snowden’s revelations about U.S. monitoring of foreign leaders, including German Chancellor Angela Merkel, who is one of the biggest backers of nascent trade talks between Washington and Brussels. Members of the European Parliament, which votes on certain trade policies, have been especially outspoken. This week’s legislation directs U.S. trade negotiators “to ensure that governments refrain from implementing trade related measures that impede digital trade in goods and services, restrict cross-border data flows, or require local storage or processing of data.”
Bond Tab for Biggest Economies Seen at $7.43 Trillion in ’14 - The world’s biggest economies will need to refinance $7.43 trillion of sovereign debt in 2014 as bond yields begin to climb from record lows, threatening to raise borrowing costs while nations struggle to bring down elevated budget deficits. The amount of bills, notes and bonds coming due for the Group of Seven nations plus Brazil, Russia, India and China is little changed from 2013 after dropping from $7.6 trillion in 2012, according to data compiled by Bloomberg. At $3.1 trillion, representing a 6 percent increase, the U.S. faces the largest tab. Russia, Japan and Germany will see refinancing needs drop, while those of Italy, France, Britain, China and India increase. While budget deficits in developed nations have fallen to 4.1 percent of their economies from a peak of 7.8 percent in 2009, they remain about double the average in the decade before the credit crisis began. The cost for governments to borrow may rise further after average yields last year rose the most since 2006, as the global economy shows signs of improving and the Federal Reserve pares its unprecedented bond buying. Debt as a proportion of the economies of the 34 members of the Organization for Economic Cooperation and Development will rise to 72.6 percent this year from 70.9 percent last year and 39 percent in 2007, according to the group’s forecasts.
A dismal new year for the global economy | Joseph Stiglitz -- Economics is often called the dismal science, and for the last half-decade it has come by its reputation honestly in the advanced economies. Unfortunately, the year ahead will bring little relief. Real (inflation-adjusted) per capita GDP in France, Greece, Italy, Spain, the United Kingdom, and the United States is lower today than before the Great Recession hit. Indeed, Greece's per capita GDP has shrunk nearly 25% since 2008. There are a few exceptions: After more than two decades, Japan's economy appears to be turning a corner under Prime Minister Shinzo Abe's government; but, with a legacy of deflation stretching back to the 1990s, it will be a long road back. And Germany's real per capita GDP was higher in 2012 than it was in 2007 – though an increase of 3.9% in five years is not much to boast about. Elsewhere, though, things really are dismal: unemployment in the eurozone remains stubbornly high and the long-term unemployment rate in the US still far exceeds its pre-recession levels. In Europe, growth appears set to return this year, though at a truly anaemic rate, with the International Monetary Fund projecting a 1% annual increase in output. In fact, the IMF's forecasts have repeatedly proved overly optimistic: the Fund predicted 0.2% growth for the eurozone in 2013, compared to what is likely to be a 0.4% contraction; and it predicted US growth would reach 2.1%, whereas it now appears to have been closer to 1.6%. With European leaders wedded to austerity and moving at a glacial pace to address the structural problems stemming from the eurozone's flawed institutional design, it is no wonder that the continent's prospects appear so bleak.
IMF to revise up global growth forecasts -- The International Monetary Fund will revise upward its global growth forecast in about three weeks, Managing Director Christine Lagarde has revealed. "We will be revising upwards the global forecast of the economic growth," she told a press conference in the Nairobi, adding that it would be premature to say any more. Ms Lagarde, who was wrapping up a two-day visit to Kenya, gave no reason for the revision. When it issued its latest World Economic Outlook report in October, the IMF lowered its forecasts, saying that global growth "remains in low gear". It said it expected the global economy to grow 2.9pc year-on-year in 2013 and 3.6pc in 2014. That represented a downward revision of 0.3 and 0.2 percentage points, respectively, from its July estimates. Emerging market economies, although still accounting for most global growth, were losing more momentum than previously thought, the IMF said in November, although advanced economies, in particular the US, were showing signs of picking up.
All The World's PMIs In One Chart -- Of the 21 nations covered by PMI "soft data" surveys, only 4 have sub-50 (deceleration) prints - Russia remains at multi-year lows along with France (core Europe?), Australia (but but China?), and Greece. Of course, as Goldman (some of the optimism on the basis of recent manufacturing PMIs... may not square with evidence of a structural break in the link between the PMIs and growth) and BofAML (it's important to understand how crude these surveys are) note, faith in these 'surveys' is often misplaced (and current levels suggest the rolling over is coming soon). Bear in mind, Goldman's own work on "soft data" surveys like PMI in Europe - We conclude that some of the optimism on the basis of recent manufacturing PMIs... may not square with evidence of a structural break in the link between the PMIs and growth. While a reading of 50 may in pre-crisis days have indicated positive growth... it today may only indicate flat growth, as the external financing constraint prevents better sentiment from translating into activity.
Botswana Bushmen: Modern life is destroying us: We are in New Xade, a resettlement camp an hour's drive from the nearest town, Ghanzi, in western Botswana. It is the new home of the Basarwa - Kalahari Bushmen, southern Africa's first inhabitants and yet they do not take much pleasure in this honour. Sisters Boitumelo Lobelo, 25, and Goiotseone Lobelo, 21, are kneeling in front of a basin of dirty water, washing their children's clothes. Their eyes fill with anger when they speak of their life here, a desolate village half a day's drive from their original home, which is now part of the Central Kalahari Game Reserve (CKGR). "I miss my home and the way we lived. Life was easy, there were lots of fruits, animals and there were no bars and no beer. Now we are lost," says Goiotseone. They have been to visit a number of times since they were evicted but are not allowed to stay there any more.
The BRICs Have Hit a Wall - Only a short time ago, the world’s emerging markets, especially the BRICs — Brazil, Russia, India and China — were supposed to be the saviors of the global economy. As the West sank into a recession in the wake of the 2008 financial crisis, China, India and many other developing economies continued to post strong growth, helping to prevent the world economy from tumbling into an even deeper and more painful downturn. As the U.S. and Europe struggled to recover, talk that the giants of the developing world were destined to take their place at the top of global economic and political affairs accelerated. Now, however, with the opening of 2014, many emerging markets look like they’re the ones that need saving. Investors are fleeing markets from Latin America to Asia, tanking currencies, stocks and sentiment. The good money is now betting on the once battered advanced nations. What’s gone wrong? Some of the turmoil has been inadvertently brought on by the U.S. Federal Reserve. After flooding the world with billions of dollars through unorthodox bond-buying programs to boost the U.S. economy, the Fed is beginning to scale back — or “taper” — those efforts, and jitters over the impact of that unprecedented unwinding is scaring investors from assets perceived as high risk. Especially vulnerable are emerging economies that have become dependent on cheap and easy foreign funds to finance current-account deficits, like Turkey and Indonesia. Turkey’s currency, the lira, hit a record low in recent days, while Indonesia’s rupiah has sunk to levels not seen since the Asian financial crisis of the late 1990s
Brazilian Inflation Set to End Year Above Target -- Inflation in Brazil is expected to round out the year well above target for the fourth year running when data is released Friday. The consumer price index is expected to reach 5.74% for 2014, according to this week’s central-bank survey of 100 analysts and economists from banks and brokerages.It’s the fourth year that annual inflation will be above 5.5% and far higher than the government’s official target of 4.5%. Everything suggests this year will make it the fifth year in a rose: inflation is expected to inch higher again in 2014, to 5.97%, according to the central bank survey. Brazil may be far away from the hyperinflationary crises that crippled the country in the past, but it’s still clearly struggling to cope. Since inflation targeting was introduced in 1999, the number has been below target just four times: in 2000, 2006, 2007 and 2009. The constant pressure on prices fueled some of the frustration that led millions of Brazilians to protest across many towns and cities last year. The protests have largely died down but the anger remains alive
Venezuela hikes minimum wage 10 pct amid galloping inflation (Reuters) - Venezuelan President Nicolas Maduro on Monday announced a 10 percent increase in the minimum wage and pensions in efforts to maintain consumer spending power amid spiraling inflation that reached 56.2 percent last year. Maduro blames the soaring consumer prices on an opposition-led effort backed by Washington, though critics say it is the product of an aggressive expansion of the money supply and declining productivity of the economy. "This is because we are at war," Maduro said during a televised broadcast announcing the measures. "There is an economic war against the country and we are defending ourselves." Maduro said the increase would leave the minimum wage rising faster than inflation over 12 months. The hike would put the monthly minimum wage at 3,270 bolivars. That is equivalent to $519 at the official rate, which economists say is vastly over-valued, but only $51 at the black market rate.
Argentine peso hits new lows as food price controls take effect (Reuters) - Argentina's peso slid to an all-time low on Tuesday as supermarkets implemented food price freezes in an agreement with the government aimed at protecting poor families from one of the world's highest inflation rates. The year-long price deal on 200 on basic food products, agreed to last week and implemented on Monday, signals a deepening of President Cristina Fernandez's interventionist policies. With two years left in her second term, food prices are being pumped higher in part by the devaluation of the peso. Polls show her reputation has been battered by 25 percent inflation, falling central bank reserves and electricity shortages caused by low investment after implementing tight currency and trade controls and seizing the country's top energy company YPF last year. Investors eager to get in on Argentina's vast grains sector and promising shale oil reserves had hoped for a change toward business-friendly policies when Fernandez lost congressional clout in the October mid-term election. But since then she has doubled-down in defense of her unorthodox policy model.
Two Latin Americas? MERCOSUR vs Pacific Alliance - Think of the Wall Street Journal's op-ed pages as a confused bastion of conservative thinking and you won't go far astray. Such wooly thinking is evident in a recent piece about "The Two Latin Americas" that purportedly contrasts anti-enterprise, anti-trade and anti-American countries (Argentina, Brazil, Venezuela) with pro-enterprise, pro-trade, and pro-American countries (Mexico, Peru, Chile and Colombia). The former group is composed of MERCOSUR customs union members doing poorly, while the latter group is composed of the more recently formed group the Pacific Alliance doing better. You do not need to convince me that Argentina and Venezuela are run by left-wing ideologues/nutters with few sane ideas about how to run their countries. Argentina is so pathetic that it blatantly falsifies inflation data, while Venezuela is suffering from uncontrolled crime, rampant inflation, goods shortages...you name it. Brazil, though, I am not sure falls into the same category of economic mismanagement. Look past the WSJ op-ed pages' Manichaean, crusader-grade morality play [freedom good, markets good, America good!] and there is actually more to the story. In particular, the characterization of Chile is disingenuous. It probably would not fit into the mould of other Pacific Alliance countries as being led by staunchly conservative figures. Chile's leader Michelle Bachelet is an unapologetic socialist, and won their recent presidential elections on a platform of unabashedly redistributive policies that would make a WSJ op-ed page writer retch: So when did WSJ commentary start lauding a country run by some Latin American woman who talks like a commie campaigning on [heaven forbid] raising taxes? The morality play of pro-market, pro-American countries doing better plays to the choir--except that the one identified as one of the best-performing is actually rather leftist. Nor can they claim that Bachelet hasn't had the Obama-like opportunity to wreck Chile, since she was already its leader from 2006 to 2010 (this is her second term in office). Last I checked, Bachelet was also seeking to establish better ties with MERCOSUR nations and avoid precisely the kind of MERCOSUR - Pacific Alliance polarization the WSJ writer fetishizes about:
German Turns Near Record Trade Surplus in November -- Germany’s trade surplus widened to a near record in November, official figures showed Wednesday in a development that may add potential fuel to critics’ concerns that the country is not spending enough to help out its struggling partners in the eurozone. The figures could well form the backdrop to discussions later between U.S. Treasury Secretary Jacob Lew and German Finance Minister Wolfgang Schaeuble. Lew has voiced his opinion that Germany should be looking to get its current account more into balance as a means of shoring up the eurozone’s stragglers. Wednesday’s figures from the Federal Statistical Office showed Germany posting a surplus in November of 17.8 billion euros ($24.2 billion), up from a downwardly revised 16.7 billion the previous month. A more detailed look showed exports rose 0.3 percent compared with the previous month to 93.2 billion euros when adjusted for seasonal and calendar factors, while imports declined 1.1 percent to 75.4 billion euros. Germany, Europe’s biggest economy, has for a while been criticized of relying too heavily on its exports and not importing enough to boost other economies in what is now the 18-country eurozone following Latvia’s adoption of the single currency at the start of the year. The United States, for one, has urged Germany to spend more while the International Monetary Fund has said a smaller surplus is the only way to even out the imbalances that plague the eurozone.
Where Deflation Risks Stir Concerns - Relatively few people alive today in the West have experienced deflation, but for Europeans, that may be changing. Anxieties are rising in the euro zone that deflation—the phenomenon of persistent falling prices across the economy that blighted the lives of millions in the 1930s—may be starting to take root as it did in Japan in the mid-1990s. "Deflation: the hidden threat," ran a headline emblazoned across a December research note by economists at HSBC. At last count, prices are falling only in Latvia, Greece and Cyprus. And most forecasters, including those at HSBC, see low inflation as more likely than deflation on average in the euro zone.But inflation is stubbornly low, under 1% on average across the 18-nation bloc, despite the money that the European Central Bank has been pumping into the economy with the aim of spurring investment and growth, actions that often push up inflation. That is way under the ECB target of "below, but close to 2%," and, if the average is below 1%, more economies using the euro are at risk of deflation.
Euro-zone inflation falls back in December - The annual rate of inflation across the 17 countries that then shared the euro fell further below the European Central bank's target in December, rekindling fears that too little inflation, rather than too much, could threaten the currency area's fragile recovery. The European Union's statistics agency Tuesday said a preliminary reading showed consumer prices rose by just 0.8% over the 12 months to December, a decline in the annual rate of inflation from 0.9% in November. The rate of inflation was last lower in October, when it touched 0.7%, prompting the ECB to cut its benchmark interest rate to a low of 0.25%, the last action it took to stimulate the economy. The ECB targets an inflation rate of just below 2.0%. After stripping out more-volatile food and energy prices, inflation was just 0.7%. Separate figures from Eurostat suggested consumer prices are unlikely to rise sharply in coming months. The agency said the price of goods leaving factory gates in November fell for the second straight month, although by just 0.1%. Prices at the factory gates don't translate directly into prices paid by consumers, since retailers and other service providers must cover their costs and make profits, but they do have a significant influence. The latest numbers are a reminder that dangerously low inflation--which Japan struggled with for two decades and the U.S. central bank has spent hundreds of billions of dollars to avoid--is at Europe's front door.
Falling again -- TODAY’S inflation figures will worry the European Central Bank (ECB), whose governing council is due to meet on January 9th. According to Eurostat’s preliminary estimate, inflation has fallen from 0.9% in the year to November to 0.8% in December. A particular concern is that core inflation, which strips out energy, food, alcohol and tobacco from the all-items index, has fallen from 0.9% to 0.7%., Both measures are uncomfortably lower than the ECB’s target for inflation, of below but close to 2%. Overall inflation is still a bit higher than its recent low of 0.7% in October. But core inflation is now at a record low for the euro zone since it came into being 15 years ago, on records based on the changing composition of the zone (which started with 11 members); and it matches the previous record low in February 2010, on figures based on the 17-strong membership of last year (Latvia joined on January 1st, expanding the currency club to 18). The downward move in core inflation is likely to be especially disconcerting for the ECB. Its forecast last month envisaged headline inflation averaging 1.1% this year, down from 1.4% in 2013. But it also predicted core inflation (on a measure excluding energy and food but not alcohol and tobacco) of 1.3% this year, up from 1.1% in 2013.
Deflation is a Problem of an Inflation Rate That is Too Low - When someone touts the risks of deflation it is simply their way of saying that they don't understand the economy. The NYT provided us this service in an article on how the euro zone is seeing a lower than desired rate of inflation. After noting that year over year inflation was just 0.8 percent in the most recent data, well below the European Central Bank's 2.0 percent target, the article tells readers: "Europe could face outright deflation — a debilitating economic condition in which prices actually decline across the board. "Deflation would only add to the broader economic malaise in the region, by hurting corporate profits and by leading consumers to delay purchases in anticipation of better deals in the future. It would also weigh heavily on borrowers, making loan repayments more expensive in real terms — a particular danger for Europe’s already fragile financial sector."Okay, let's get this straight. It's okay if the inflation rate is 0.2 percent or 0.3 percent, but all hell breaks loose if we are looking at 0.5 percent deflation? How does that work? The article tells us corporate profits will be lower. Well, ignoring the fact that corporate profits are currently very high, how does a dip from 0.3 percent inflation to 0.5 percent deflation affect corporate profits in a way that is different from a dip from 1.1 percent inflation to 0.3 percent inflation? If the inflation rate is lower than what businesses had expected then they will be selling their output for a lower than expected price. That means lower profits regardless of whether or not the lower inflation rate is positive to negative. As far as consumers delaying purchases, let's try some arithmetic. Suppose someone is considering a big ticket item like a television or a refrigerator that costs $1,000. If the rate of deflation is 0.5 percent, our would be buyer would save $2.50 by delaying their purchase for six months. They would get a $5 windfall if they delay the purchase a full year. Is this going to be a big problem?
So far the ECB is not responding to ultra-low inflation readings - The Euro area inflation indicators are pushing into dangerous territory. The core CPI measure in particular is trending sharply lower. The ECB has so far been taking a "wait and see" attitude, though some on the Governing Council are apparently getting concerned. Chicago Tribune: - Core inflation, which strips out volatile costs like food and energy, hit a record low of 0.7 percent. The readout will heighten concerns at the ECB about entrenched price weakness taking hold, though strong company activity towards the of last year will give them some comfort. "Obviously they are worried, but it's not significantly lower than it was a month earlier," . "I don't think it's enough to prompt a new rate cut but I do think it's enough to keep them dovish and ready to act. Of course it's no longer about lowering the overnight rate. Given the persistent credit contraction in the euro area (see post), there is pressure on the ECB to add liquidity to the banking system by potentially providing another round of LTRO financing. The current LTRO balances are nearly half what they were after the last 3-year financing program was offered in 2012 (see story). But many analysts believe the ECB will be on hold for some time because of seeming economic improvements in the Eurozone periphery (see chart below) as well as stronger data out of the US.
Hollande Wants to "Get Things Done" by Decree, Not by Passing Laws -- Via translation from Les Echos, inquiring minds may be interested to note Holland wants to "get things done" in 2014 by decree or order, not by passing laws. The first cabinet meeting of the year was held on Friday. François Hollande recalled the objective of reducing public deficits, without new taxes. To get things done despite a 2014 parliamentary calendar constrained by elections (local and European), Hollande called on ministers to pass laws only when strictly necessary, and to advance policy in other ways: by decrees or orders, said Najat Belkacem-Vallaud, minister of women's rights and governments spokesperson, leaving the first Council of Ministers. The decree is an instrument made by the President or the Prime Minister, which specifies the conditions for the application of a law. The order is mentioned in the Article 38 of the Constitution: "the Government may, for the implementation of its program, ask Parliament for permission to make orders for a limited time, measures that are normally the domain of the law." An order comes into force upon its publication, but gets legislative value when it is ratified by Parliament. Well, let's just issue orders, then hope parliament gives legislative approval later.
Euro Jobless Scourge Seen Defying Leaders’ Growth Pledge - European Union leaders pondering the fruits of a 120 billion-euro ($163 billion) push to jump-start the economy and create jobs can look to data this week for evidence of how little has been achieved. The euro-area unemployment rate probably held near a record in November at 12.1 percent, according to the median estimate in a Bloomberg News survey of economists. That report on Jan. 8 follows tomorrow’s release of December consumer-price data. Analysts see inflation hovering near the four-year low that preceded a surprise interest-rate cut a month earlier by the European Central Bank. In December, EU leaders acknowledged their struggle to create jobs, 18 months after they unveiled the Compact for Growth and Jobs, saying unemployment remains “unacceptably high.” Governments are relying for continued support from the ECB, which may this week repeat its vow to keep its policy accommodative for “as long as necessary.”
Death By A Thousand Cuts: The Silent Assassination Of European Democracy - As is gradually dawning on more and more people across the old continent, the European Union is riddled with fatal flaws and defects. Chief among them is the single currency which, rather than serving as the Union’s springboard to global dominance, could well be its ultimate undoing. Another huge problem with the EU is its acute lack of transparency. Staggering as it may seem, in the last 20 years the Union has not passed a single audit. Indeed, so opaque is the state of its finances that in 2002 Marta Andreasen, the first ever professional accountant to serve as the Commission’s Chief Accountant, refused to sign off the organization’s 2001 accounts, citing concerns that the EU’s accounting system was “open to fraud.” After taking her concerns public, Andreasen was suspended and then later sacked by the Commission. However, by far the EU’s greatest — and certainly most dangerous — structural flaw is its gaping democratic deficit. To paraphrase Nigel Farage, the stridently anti-EU British MEP, not only is the EU undemocratic, it is fundamentally anti-democratic. While Farage may be treated as little more than an eccentric court jester by the vast bulk of the mainstream media — both in the UK and on the continent — his ideas are fast gaining ground among voters. As the Daily Telegraph columnist Peter Oborne noted in a fascinating review of the late Peter Mair’s book Ruling the Void: The Hollowing of Western Democracy, anti-European parties are on the rise throughout Europe: In France, polls suggest that the anti-Semitic Front National, which equates illegal immigrants with ‘organised gangs of criminals’, will gain more votes than the mainstream parties. The Front National has joined forces with the virulently anti-Islamic Geert Wilders in Holland, who promises to claim back ‘how we control our borders, our money, our economy, our currency’. In Britain it is likely that Ukip will win in May.
Why Reinhart and Rogoff are Wrong About the Eurozone’s Debt Structure and the Costs of Debt Mutualisation - Yanis Varoufakis - Carmen Reinhart and Kenneth Rogoff recently published a notable IMF working paper (13/266) entitled ‘Financial and Sovereign Debt Crises: Some lessons learned and those forgotten’ (December 2013). Their overarching claim is that the advanced economies are wrong to pretend that the present levels of debt can be sustained by means of fiscal austerity and without debt restructuring, sustained inflation or a combination of the two. This is a sensible argument, well grounded on empirical and historical evidence, that governments would be wise to internalise. However, while the general thrust of the Reinhart and Rogoff paper is indeed reasonable and in principle useful, their discussion of Eurozone debt crisis is founded on a factual error that, since 2010, has been underpinning erroneous policy responses to the Euro Crisis. Here is the contentious paragraph: “…the size of the problem suggests that restructurings will be needed, particularly, for example, in the periphery of Europe, far beyond anything discussed in public to this point. Of course, mutualization of euro country debt effectively uses northern country taxpayer resources to bail out the periphery and reduces the need for restructuring. But the size of the overall problem is such that mutualization could potentially result in continuing slow growth or even recession in the core countries, magnifying their own already challenging sustainability problems for debt and old-age benefit programs.” In the above paragraph, Reinhart and Rogoff are, in effect, restating the Merkel rationale for rejecting Eurobonds.
The increasing number of Euro fools - Via the Irish Economy Blog I find this very interesting interview of Mario Draghi with Der Spiegel. I was first surprised by the aggressive responses from Draghi every time he is asked about the German negative assessment of recent ECB monetary policy. I like his honesty and clarity when he asserts that all German fears about increasing inflation in the Euro area have turned to be wrong. Here is one of his answers:"DRAGHI: No, but the fears felt by some sectors of the public in Germany have not been confirmed. What haven’t we been accused of? When we offered European banks additional liquidity two years ago, it was said there would be a high rate of inflation. Nothing has happened. When I made my comment in London, there was talk of a violation of the central bank’s mandate. But we had made clear from the beginning that we are moving within our mandate. Each time it was said, for goodness’ sake, this Italian is ruining Germany. There was this perverse Angst that things were turning bad, but the opposite has happened: inflation is low and uncertainty reduced." Of course, the journalist is not convinced and continues asking questions about the potential damage that ECB policies are inflicting in Germany. He follows with a set of questions on how the low interest rate policy of the ECB is hurting savers in Germany. Maybe central bankers need to be more explicit about their (limited) influence on interest rates. The (wrong) perception among many is that interest rates, both nominal and real, for all maturities and risk profiles are determined by central bank policies.
Draghi Strengthens Pledge to Keep Rates at Record Lows Mario Draghi strengthened the European Central Bank’s pledge to keep interest rates low for as long as necessary and warned that it’s too soon to say the euro region is out of danger. “The Governing Council strongly emphasizes that it will maintain an accommodative stance of monetary policy for as long as necessary,” Draghi told reporters in Frankfurt today after the ECB kept its key rate at a record low of 0.25 percent. Draghi is refusing to say the fight against Europe’s debt crisis is won, even as stocks and bonds rally and countries such as Ireland and Portugal return to the debt market. The economy is still struggling to grow amid subdued prices and the threat of rising market rates as the U.S. Federal Reserve tapers its own monetary stimulus.
Eurozone fund chief dashes Greek hopes for debt deal - Greece's hopes for another debt deal aimed at helping it exit the bailout programme at the end of 2014 are not realistic, Klaus Regling, the head of eurozone's bailout fund (ESM), told Spiegel magazine. "There will be no debt restructuring," Regling said. The ESM is Greece's largest creditor, with €133 billion in 30-year loans already disbursed at an interest rate of 1.5 percent. "The interest on these loans was deferred for the next ten years. All this equals a debt restructuring, from an economic point of view," Regling said. There is also very little room for change with other creditors. The International Monetary Fund - contributing €27.2 billion to Greece's bailout - is not allowed to lower its interest rate. "There may be some little room for manoeuvre in the bilateral loans from the first bailout package. But that is up to eurozone member states to decide, they are the creditors there," Regling said. Greek foreign minister Evangelos Venizelos, who also served as finance minister when the bailout terms were negotiated, has warned that his coalition government may be toppled and replaced by anti-bailout parties if Greece does not get a debt deal this year.
Protests off limits for Greek presidency kick-off: AP) — Greek authorities imposed an 18-hour ban on protests across the center of Athens during events planned Wednesday to mark the inauguration of the nation's six-month presidency of the European Union. The police order will take effect at 6:00 a.m. (0400GMT) Wednesday, hours before EU commissioners, led by European Commission President Jose Manuel Barroso, attend the Athens events. A similar protest ban was imposed last year during a visit to Athens by German Finance Minister Wolfgang Schaeuble. Greece is hoping to emerge from a grueling, six-year recession during its presidency, and negotiate a landmark deal with bailout creditors to make its massive national debt sustainable. Finance Minister Yannis Stournaras said Greece could negotiate the debt deal before the end of the presidency on June 30. The country is set to achieve its central target of posting a primary budget surplus, balancing its annual public finances before interest payments. "If we stick to our basic timetable, I do believe these decisions will be made during our term in the presidency," he said.
Economic Health: Has Greece Turned a Corner? - At the beginning of the year, Greece took over the rotating European Council presidency, meaning that it has taken the helm of the 28-member EU for the next six months. Europe is now being led by a country that in the spring of 2010 plunged the European currency union into the deepest crisis in its history, a country that has been saved from collapse by two gigantic aid packages and a debt haircut for private creditors. Many in Brussels believe that Athens will need an additional €1.5 to 2 billion ($2 to 2.7 billion) this year and perhaps as much as €10 billion in 2015. Greek Prime Minister Antonis Samaras has pledged that Greece's leadership will mark a presidency of "hope" -- a word he applies to his own country, which, he says, brings a "positive balance" into the six-month position of prestige. But it has often been the case that good news from Greece is coupled with the next set of demands -- such as the current request for a renewed debt reduction. Such a move would hit European taxpayers hard, particularly those in Germany. Greece has undeniably made progress when it comes to reducing its budget deficit, improving its economy and ramping up exports, much of which came as a result of severe cuts to public spending, pensions and salaries. This year, the economy is even expected to grow for the first time since the crisis took hold, by 0.6 percent. The budget deficit is set to shrink to 2 percent this year and 1 percent in 2015. The improved macro-economic indicators are important conditions for the payout of the next tranche of aid from Europe and the International Monetary Fund.
Crisis: Greece, nearly half of incomes below poverty line - Over 44% of the Greek population had an income below the poverty line in 2013, as daily Kathimerini reports citing estimates by the Public Policy Analysis Group of the Athens University of Economics and Business (AUEB). The poverty threshold is measured as 60% of the price-adjusted average income in 2009, or up to 665 euros per person per month and up to 1,397 for a couple supporting two underage children. The AUEB researchers also found that last year 14% of Greeks earned below the adequate living standards, compared with 2% of the population four years ago. The group's report suggested that during the crisis instead of strengthening support to the unemployed – which is one of the most efficient methods to rekindle demand – the state was forced to reduce it. It added that besides the austerity policies of the last few year, the inability of the state to contain the collapse of social structures is due to the lack of targeted strategies and to the inefficient use of resources, problems that dogged Greece even before the onset of the crisis.
Unemployment hits historic high of 27.8% - The unemployment rate hit an historic, all-time high in October, with 27.8% of the workforce without a job, data from the Hellenic Statistics Authority (Elstat) showed on Thursday. The figure was more than the upwardly revised 27.7% on the previous month, which was also a record high. This means that for the seventh month running, unemployment remains above 27%, the highest rate in the entire European Union. The figures showed the total number of people employed in October at 3,597,779, the unemployed at 1,387,520 and the economically inactive at 3,360,513. This means that the country's unemployment figures have grown by more than a million in five years. In October 2008, a few months before the crisis broke, 372,578 people (7.5%) were recorded as unemployed. The figures also show that about 3.6 million people are working to support more than 4.7 million unemployed and inactive people. The data (pdf) showed that in October, the number of people with jobs fell by 21,861 compared with the previous month, representing a 0.6% decrease on the previous month. The ranks of the unemployed fell by 1,111, down 0.1%. The number of economically inactive also grew by 11,686, up 0.3%, on September. The data showed that the unemployment rate for women (32.1%) is higher than that for men (24.7%).
Unemployment hit new high of 27.8 pct in October, set to rise further. According to the Hellenic Statistical Agency (ELSTAT), the seasonally adjusted jobless rate in October stood at 27.8 percent from an upwards revised 27.7 percent in the month of September. After the previous months’ revisions, the October rate now holds the new high. Women lead the way in the unemployment stakes with 32.1 percent lacking jobs compared to 24.7 percent for men. All age groups are severely impacted by the devastating impact of the Greek depression with the unemployment rate having roughly tripled for each bracket compared to October 2009. For 25-34 year olds it stands at 37.8 percent from 13; for 35-44 at 23.8 percent from 8.3; 20.3 percent for the 45-54 age group and 16.6 percent for the 55-64 year olds. Youth unemployment impacts more than half of those between 15 and 24 looking for a job with the rate standing at 57.9 percent.
Greek Industrial Output Downturn Worsens In November. Greece's industrial production decreased for the fifth consecutive month in November, and at a faster pace than in the previous month, with all of the major industrial sectors recording decline in activity, data released by the Hellenic Statistical Authority showed Thursday. Industrial production fell a working-day adjusted 6.1 percent on an annual basis in November, following the previous month's 4.7 percent decrease. Sequentially, industrial production dropped 4.8 percent in November, after falling 7.9 percent in October, the agency said. During the January-November period, overall industrial production dropped 3.9 percent from the corresponding period of last year.
Spain Youth Unemployment Rises To Record 57.7%, Surpasses Greece - There has been much speculation recently about some immaculately conceived Spanish economic recovery. And while it has certainly sent the local Ibex stock market soaring, we fail to see any indication of such a recovery, at least in official economic data. The latest example being, of course, today's European unemployment for November, which at the Euroarea level remained flat at 12.1%, which also is the all time record high following a prior revision. However, what is more troubling is that according to the official European statistics keeper, Spanish unemployment in November was 26.7%: tied for the all time high seen in October and hardly an indicator of some imminent economic renaissance. There is, of course, always December - that month in the New Normal when hiring really picks up.
Spain's Youth Unemployment Rate Hits 57.7% as Europe Faces a 'Lost Generation' -- Spain saw its youth unemployment rate rise to a staggering 57.7% in November as the country registered the worse youth jobless rate in the eurozone area. Eurostat, the statistical information arm of the European Union, also revealed the youth unemployment rate across the eurozone remained steady at 24.2% for the second consecutive month – meaning there were 3.5 million unemployed under-25s across the region. "There is a real danger that these young people will get trapped in the ranks of the long-term unemployed," James Howat, a European economist at Capital Economics, told IBTimes UK.He explained: "Countries and their employers are losing human capital and will have to spend money to reintegrate those who are unemployed now in the long-term." In particular, Spain registered the worse unemployment rate of 57.5% over the same period – a slight increase from 57.4% the month before. In vast contrast, Luxembourg and Germany shared the lowest unemployment rate of 5.5%.
Italian Unemployment Hits 37-Year High - Italy is looking sick today. According to stats that have just come out, the unemployment rate has risen to a 37-year high of 12.7% in November. Youth unemployment jumped from 41.4% in October to 41.6% in November. This isn't the only bad Italian number lately. Recall that earlier this week, Italy clocked in with its second-straight sub-50 reading in its service sector PMI (even as most Eurozone countries showed improvement, especially Spain, with which it's frequently compared). In terms of an economy with problematic structural issues, Italy is looking more and more France-like these days.
Italian joblessness hits record as it seeks higher foreign investment - Italian joblessness has hit a fresh high, underlining the challenge for the country’s fragile coalition in convincing the international markets it is on the path to recovery. Unemployment hit 12.7pc in November, up from October’s 12.5pc and the highest on record. Youth unemployment, at 41.6pc, is also at an all-time high. The figures show that tentative signs of recovery in Italy's recession-battered economy have failed to benefit the labour market. Italy hopes to raise €470bn (£387bn) from bond sales this year, similar to its 2013 funding target. But the government is under pressure to attract more interest from foreign buyers, since Italy’s domestic banks are expected to slow their purchases of sovereign debt this year. The Treasury is confident that high yields on its debt will entice international buyers. But political gridlock within the country’s fractious coalition is likely to put off investors looking for reassurance Italy can carve a path to economic recovery.
Euro plummets after ECB warning --The European Central Bank sent the euro tumbling on world markets after it warned that the 18-member currency zone may need further support to prevent a Japanese-style period of stagnation. The ECB president, Mario Draghi, said persistently high unemployment, falling inflation and difficult lending conditions were harming the recovery, and the ECB stood ready to use all the tools available to maintain confidence and growth. Speaking as the central bank kept interest rates at 0.25% on Thursday, he said the ECB would consider printing money as well as other measures should there be a further deterioration in the availability of credit or another drop in inflation. "The governing council strongly emphasises that it will maintain an accommodative stance of monetary policy for as long as necessary," he said. The warning came as the UK economy appeared to be moving strongly in the opposite direction and concerns that it will soon overheat. The Bank of England's monetary policy committee kept base interest rates steady at 0.5% at its January meeting but an increasing number of analysts called on the Bank's governor, Mark Carney, to prepare for a rate rise as early as the summer. Carney has signalled his intention to keep rates at ultra-low levels until the recovery is assured, which Threadneedle Street believes will be mid-2015 at the earliest. But the unexpectedly sharp rise in gross domestic product over the last year and the speed with which employers are adding jobs has convinced many economists that rates should rise earlier.
Gambling for Resurrection in Iceland – via Naked Capitalism - Yves here. We’ve featuring a nice piece of crisis-related forensic work. Too bad we’ve seen so little of this sort of thing. The article describes some of the desperate and illegal measures pursued by one of the big Icelandic banks, Kaupthing, before its collapse. It draws some important lessons, including regulatory failures, both of the rules themselves and of lax oversight. In 2008, Icelandic banks were too big to fail and too big to save. The government’s rescue attempts had devastating systemic consequences in Iceland since – as it turned out – they were too big for the state to rescue. This column discusses research that shows how this was a classic case of banks gambling for resurrection.
Cutting public investment has consequences: house building - - Here are two charts that tell their own story. The first comes from this site. The second shows UK house prices from Nationwide. Almost everyone agrees that UK house prices are currently much too high, and (partly thanks to you know who) getting higher. It is also clear that if you cut back on supply, but pressures on demand remain, prices will rise. In the first half of the 1980s, public sector house building effectively came to an end. Mrs Thatcher’s government did this, despite knowing that demand for housing was going to carry on increasing, as Ed Conway discovers (from the just released archives) in this post. In 1984 her housing minister advised against cuts on the scale actually made. Presumably Mrs Thatcher and her advisers hoped that the private sector or housing associations would fill the gap, but they did not, so prices started rising. [1] Cutting back on public investment, and just hoping the private sector will increase their investment to compensate. Does that sound familiar? Cutting back on public investment, and paying for the consequences later. Does that sound familiar? Never mind, just keep repeating 'private sector good, public sector bad', and continue to get your facts from certain newspapers.
Note to NYT on Coverage of UK Austerity: Economies Ordinarily Grow - The NYT discussed the state of debate in the United Kingdom on the conservative government's austerity policy. The piece notes that the economy is now growing again and implies that the austerity policies might be the basis for this renewed growth. Actually, economies almost always grow, so there really should not be much debate about whether austerity policies deserve credit. This is like noticing that a child is taller at age six than she had been at age five and then boasting that her growth must have been attributable to six months of a near starvation diet. While that may be the nature of political debate in the United Kingdom, the billions of people around the world who know that children grow would recognize it as absurd. Similarly, it is absurd to say that an economy has resumed growth after years of recession or near recession conditions, owes this growth to austerity. The NYT is not supposed to present delusions of political leaders to its readers as plausible explanations of reality.
Funds with $100 Million May Be Too Big to Fail, FSB - Investment funds that manage more than $100 billion in assets may be labeled too big to fail, global regulators said, as they seek to expand financial safeguards beyond banks and insurers. Hedge funds with trading activities exceeding a set value of $400 billion to $600 billion would also be assessed by national authorities to gauge whether they need extra rules because their collapse could spark a crisis, the Financial Stability Board said in a statement yesterday. The report addresses “the risks to global financial stability and economic stability posed by the disorderly failure of financial institutions other than banks and insurers,” Mark Carney, Bank of England governor and FSB chairman, said in the statement. “They are integral to solving the problem of financial institutions that are too big to fail.” The FSB, which brings together regulators and central bankers from the Group of 20 nations, is ranking banks and insurers by their potential to cause a global meltdown and demanding bigger financial cushions to avert a repeat of the 2008 credit freeze. Industrial & Commercial Bank of China Ltd., the world’s most profitable lender, was added to the FSB’s list of too-big-to-fail banks in November. Insurers such as American International Group Inc. and Allianz SE were deemed systemically important in July.


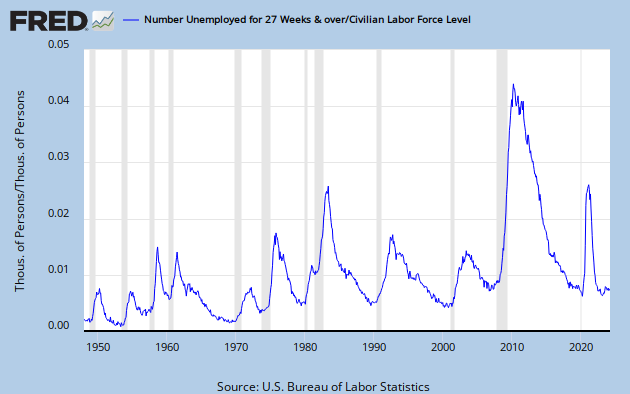
No comments:
Post a Comment